Download
1 / 10
100 likes | 204 Views
Tanya Bruskewitz, Amy Schmidt, Matt Serwe. Decrease of Anthropogenic Influence on Atmospheric CO2 Levels. The Experiment. Trend 1: 1% increase in the CO2 level from 2000 to 2010, then plateau to 2070. Trend 2: 1% increase in the CO2 level from 2000 to 2040, then plateau until 2070.

E N D
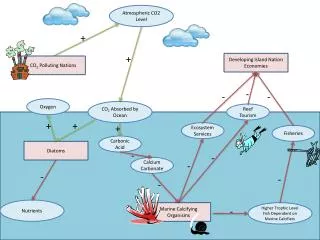
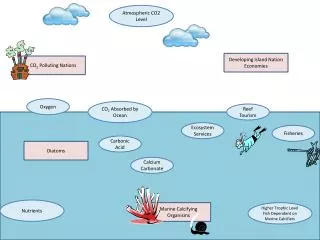
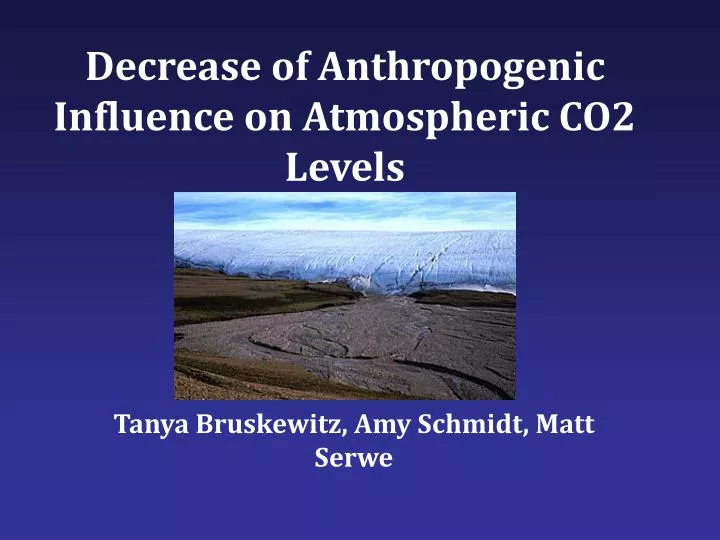
Tanya Bruskewitz, Amy Schmidt, Matt Serwe Decrease of Anthropogenic Influence on Atmospheric CO2 Levels
The Experiment • Trend 1: 1% increase in the CO2 level from 2000 to 2010, then plateau to 2070. • Trend 2: 1% increase in the CO2 level from 2000 to 2040, then plateau until 2070. • Trend 3: 1% increase in the CO2 level from 2000 to 2070. • Control: Global Warming Run with a CO2 trend analogous to the current trend- 1.9% increase.
Run #1 vs. Control • CO2 levels in 2010: • Atmospheric CO2 = 410 ppm • Very encouraging, but highly unlikely • Snow and ice coverage increases at the poles and on land in the Northern Hemisphere • Global average temperature decrease = -6.97°
Run #2 vs. Control • CO2 levels in 2040: • Atmospheric CO2 = 553ppm • No need to show a temperature map because it is analogous to Run #1 • Curbing the trend of melting snow and ice with a more realistic CO2 trend • Evaporation occurs more over land and tends to rain out over the oceans
Run #3 vs. Control • CO2 levels in 2070: • Atmospheric CO2 level = 746ppm • Generally less dramatic cooling • Ground albedo decreases at the South Pole • Most realistic of the three runs based on CO2 trend
Summary • Our models show an optimistic future for the world if changes are made now • Current Proposal in the Senate • Systematic reduction of CO2 emissions by cap-and-trade policy • Encourage people to “Go Green” • It WILL HELP!