Download
1 / 32
320 likes | 428 Views
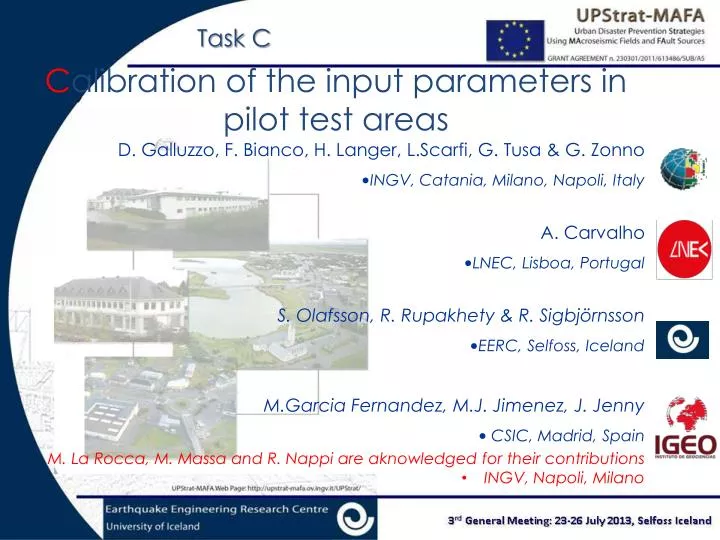
Task C. C alibration of the input parameters in pilot test areas. D. Galluzzo, F. Bianco, H . Langer, L.Scarfi , G. Tusa & G. Zonno INGV, Catania , Milano, Napoli, Italy A. Carvalho LNEC, Lisboa , Portugal S. Olafsson , R. Rupakhety & R. Sigbjörnsson

E N D
TaskC Calibration of the input parameters in pilot test areas • D. Galluzzo, F. Bianco, H. Langer, L.Scarfi, G. Tusa & G. Zonno • INGV, Catania, Milano, Napoli, Italy • A. Carvalho • LNEC, Lisboa, Portugal • S. Olafsson, R. Rupakhety & R. Sigbjörnsson • EERC, Selfoss, Iceland • M.Garcia Fernandez, M.J. Jimenez, J. Jenny • CSIC, Madrid, Spain • M. La Rocca, M. Massa and R. Nappi are aknowledged for theircontributions • INGV, Napoli, Milano
Main Goals of Task C: • Calibration of earthquake source, path and site parameters/physical quantities by comparison between observed and synthetic waveforms. The application of the finite fault stochastic approach. • Simulation of scenarios for strong and rare earthquakes for which real data may not be available
Task C - D E L I V E R A B L E S C1.1 Definition of the critical points to calibrate the input parameters of the finite fault stochasticprogram C2.1 Estimates of input parameters of EXSIM for the pilot study in test area 1 (Mt Etna ML=4.8, Mt Vesuvius MD = 3.6 , Campi Flegrei MD=2.2) C2.2 Estimates of input parameters of EXSIM for the pilot study in test area 2 (Azores Islands Mw=6.0, mainland and offshore Portugal) C2.3 Estimates of input parameters of EXSIM for the pilot study in test area 3 (Spain, ML > 4.5) C2.4 Estimates of input parameters of EXSIM for the pilot study in test area 4 (South Iceland MW=6.5) C3.1 Computation of synthetic ground shaking at the pilot test sites C4.1 Computation of synthetic macroseismic fields derived from simulated PGV C5.1 Enriched dataset using observed and synthetic bedrock Mfs.
Outline • Strategy of work: • Calibration of ground motion parameters: application of a stochastic approach • (EXSIM code, Motazedian and Atkinson, 2005) • 1 - Definition of critical points to calibrate physical quantities and parameters • 2 - Calibration: examples of applications for the investigated areas • 3 - Conclusions and Further developments
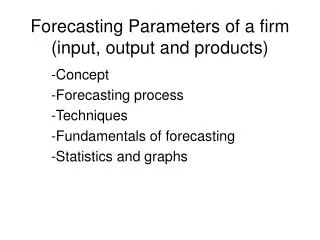
Definition of Critical Points for CalibrationProcedure • The different data set characteristics have induced the participants to fix the criticalities that could be arise in managing different areas: • the low magnitude data set for some areas; • the application of stochastic approach for small faults; • the variation of input parameters relative to the wide hypocentral distance range and focaldepth of earthquakes; • the uncertainties associated to some input parameters (stress drop for low magnitude earthquakesand time duration); • - Ground Motion Parmeters to be evaluated: PGA (PGV for small-to-moderate earthquakes), Response Spectra (5%), Housner/Arias Intensity...
Calibration of input parameters • …the most important parameters: • Source: Magnitude, Fault dimensions, Stress Drop, Subfault divisions • Path: Q(f,R) attenuation parameter • Site: High frequency decay “k” parameter, Empirical ”Site Effect” function • ..Others: Time duration
Source parameter: • the Magnitude ..a tool for a UNIFORM earthquakesizedetermination … Seismic Moment estimation from lowfrequencyflat part of displacementspectrum (Havskov & Ottemoller, 2010) From Catalogue ML=5.3, from LowFrequencyDisp. SpectraMw=5.1 +/-0.2 2000-06-21 00:55:13 South Iceland EQ Mw = 5.1
2007-08-01 23:38:16 Mt. Etna EQ Catalogue ML = 3.2 MD = 3.3 ---- LowFreq. Disp. SpectraMw = 3.3 +/- 0.2 Mw = 3.3
2012-09-07 07:34 Campi Flegrei EQ Catalogue MD= 1.7 -- -- LFDS Mw = 2.5 +/- 0.2 Mw = 2.5
Campi Flegrei (Southern Italy, Area 1) • MD[-0.3, 2.2], Depth [0.5, 3.0] km b.s.l., • 30 seismic events in the period 2000 - 2012 • Epicenters of selected earthquakes (red stars) • Seismic stations (blu triangles)
..An example of VT earthquake.. • Volcano-Tectonic Seismic Event occurred on 07-09-2012; MD=1.7 • Geostructural Map of Campi Flegrei (Di Vito et al., 1999)
Volcano-Tectonic Seismic Event occurred on 07-09-2012 MD=1.7 --- MW=2.5 +/- 0.2
CalibrationResults: Sensitivity to Stress Drop Sim. 1 bar Sim. 7 bar Sim. 15 bar Obs.E-W Obs. N-S
CalibrationResults: Sensitivity to Stress Drop Sim. 1 bar Sim. 7 bar Sim. 15 bar Obs.E-W Obs. N-S
Stochastic Simulation vs Empirical Results • for VT earthquake occurred on 07-09-2012, 07:34 • [km]
Mt. Vesuvius (Southern Italy, Area 1) • MD[1.5, 3.6], Depth =[0.0, 4.0] km b.s.l., • 50 seismic events in the period 1999 - 2012
Results of Calibration : Sensitivity to Stress Drop Sim. 1 bar Sim. 5 bar Sim. 12 bar Sim. 20 bar Obs.E-W Obs. N-S
Sensitivity to Q and high freq k values k=0.015 k=0.04 k=0.06 Q=10 f 0.5 Q=30 f 0.7 Q=50 f 0.8
Mt. Etna (Southern Italy, Area 1) • ML[3.0, 4.8], Depth =[5.0, 30.0] km b.s.l., • more than 120 seismic events in the period 2006 - 2011 Epicentres of selected earthquakes and seismic stations of the RSPSO (triangles) for the Etnean zone.
Results of Calibration procedure: synthetic vs predicted PGA Empirical and synthetic ground motion prediction for a superficial ML=3.3 earthquake. Empirical and synthetic ground motion prediction for a deeper (z= 10 km) ML=4 earthquake.
Azores Island, Mainland and Offshore of Portugal (Area 2) • ML[3, 6], Depth =[5.0, 30.0] km b.s.l., • 47 seismic events in the period 1969 - 2006 Strong-motion network stations (yellow triangles) in Central Group Azores Archipelago.
K parameterestimation Left:Example of k estimations from the amplitude Fourier spectra of acceleration. Right: Example of a displacement-amplitude spectra of S-waves and lines of ω2 model
Southern Spain (Area 3) • ML[3.3, 5.2], Epicentral dist. < 100 km, • selected well constrained 24 seismic events in the period 1999 - 2012 Earthquakes 1999-2012 (red circles) and strong-motion stations (white triangles) selected for calibration and validation.
Results of Calibration : ground motion simulations at two sites (55 km NE, and 5 km SW of the epicenter) were done to evaluate the effect of stress drop parameters Sensitivity of spectral amplitudes (FAS, PSA, PSV) to different values of the stress parameter (50, 100 and 200 bar). (a) Site 1, (b) Site 2.
Results of Calibration procedure: synthetic vs observed FAS and PSA 02/03/2008 M3.5 Vega Baja earthquake. Comparison of recorded and EXSIM-simulated horizontal-component spectral amplitudes (FAS and PSA) at stations TOR, GUA and CTG.
South Iceland (Iceland, Area 4) South Iceland map. The faults of the largest earthquakes since 1912 are indicated and the stations in the Icelandic Strong Motion Network are shown triangles.
Calibration and Simulations for the South-Iceland was done earthquake on July 21, 2000 (Mw6.5) Observed (black dashed) and simulated (red solid curve) Mw6.5 seismic event accelerograms for 9 stations of Icelandic Strong Motion Network.
Acceleration response spectra, with 5% damping, for 9 stations of Icelandic Strong Motion Network. A comparison of the average PSA for the simulations (red curve) and PSA of the measured acceleration records for Mw6.5 earthquake.
Conclusions and FurtherDevelopments • The StochasticAprroachhasrevealed a goodtool to calibrate source, path and site parameters/physicalquantities; • The joint use of the different Data Set hasallowed to define the limits of applicability, the potentiality of implementation of stochastic procedure and give an interesting general overview of seismologicalquantitiesreferred to differentareas; • The nextstepconsists on the application of well-calibratedparameter to genereate large earthquake scenario.
Thankyou! TASK CA L I B R A T I O N S I M U L S I M U T I O N A T I O N