Download
1 / 23
230 likes | 364 Views
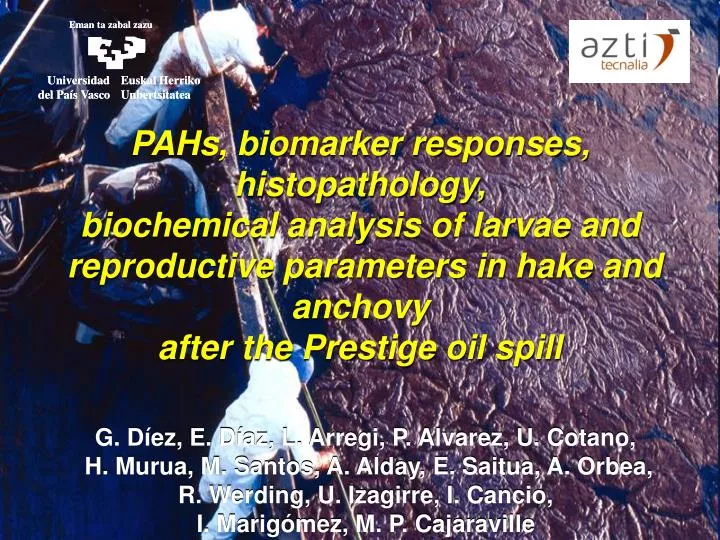
Eman ta zabal zazu. Eman ta zabal zazu. Universidad del País Vasco. Universidad del País Vasco. Euskal Herriko Unbertsitatea. Euskal Herriko Unbertsitatea. G. Díez, E. Díaz, L. Arregi, P. Alvarez, U. Cotano,

E N D
Emanta zabal zazu Emanta zabal zazu Universidad del País Vasco Universidad del País Vasco Euskal Herriko Unbertsitatea Euskal Herriko Unbertsitatea G.Díez, E. Díaz, L. Arregi, P. Alvarez, U. Cotano, H. Murua, M.Santos, A. Alday, E. Saitua, A. Orbea, R. Werding, U. Izagirre, I.Cancio, I. Marigómez, M. P. Cajaraville G.Díez, E. Díaz, L. Arregi, P. Alvarez, U. Cotano, H. Murua, M.Santos, A. Alday, E. Saitua, A. Orbea, R. Werding, U. Izagirre, I.Cancio, I. Marigómez, M. P. Cajaraville PAHs, biomarker responses, histopathology, biochemical analysisof larvaeand reproductive parameters in hake and anchovy after the Prestige oil spill
To assess the effects of the Prestige oil spill in commercial fish species in the Bay of Biscay OBJECTIVE: -Selected species : hake (M. merluccius) and anchovy (E. encrasicolus) - commercial importance in local fisheries - representative of demersal and pelagic habitats North Peñas-Ajo (PA) Ajo-Bidasoa (AB) South Miño-Fisterra (MF)
Selected tools: 1.- Chemical analysis of PAHs concentration in flesh 2.- Exposure and effect biomarkers 3.- Liver and gonad histopathology 4.- Biochemical and nucleic acid analysis, growth rates and K index 5.- analysis of historical series of fecundity parameters
1. Chemical analysis of PAH concentration in flesh PPAHs average concentration (g/kg dry weight) in flesh of anchovy (61 samples) and hake (107 samples) HAPs HAPs average average Pyrene 16,0 Naphthalene 6,3 Phenanthrene 11,0 1-methyl naphthalene 5,7 Naphthalene 9,2 2-methyl naphthalene 4,2 Fluoranthene 4,5 Biphenyl 3,0 1-methyl naphthalene 4,1 Pyrene 2,2 2-methyl naphthalene 3,6 Phenanthrene 2,1 1-methyl phenanthrene 1,4 Fluoranthene 1,7 Anthracene 0,5 2,6-dimethyl naphthalene 0,8 Fluorene 0,5 Anthracene 0,8 Chrysene 0,1 Acenaphthylene 0,1 Gas Chromatography/Mass Spectrometry, analysis of 24 PAHs 2004 anchovy hake Average: 27.2 g/kg dry weight Average: 51.1 g/kg dry weight
1. Chemical analysis of PAH concentration in flesh PCorrelation coefficient PAHs average concentration in flesh hake and length (n:107) Samples of 2005 year in process
2.- Exposure and effect biomarkers BIOMARKERS AS EARLY WARNING SIGNALS EXPOSURE BIOMARKERS -EROD activity -peroxisome proliferation: (Vvp and AOX activity) EFFECT BIOMARKER -Lysosomal membrane stability test *No previous data in selected especies
2.- Exposure and effect biomarkers 2004 2005 • CYP1A1 induction: 7-ethoxyresorufin O-deethylase (EROD) activity anchovy EROD activity in S9 fraction 3 2 pmol resorufin/ min/mg prot 1 0 Male North Male South Female North Female South BEQUALM intercalibration programme - EROD activity in cod liver - Protein concentration in cod liver and muscle
2.- Exposure and effect biomarkers ) 3 / µm 3 2004 VvP (µm 2005 Palmitoyl CoA-oxidase Activity 2 * • Peroxisome proliferation anchovy 1,5 * AOX (mU/mg prot) 1 0,5 DAB 0 Volume Density of Peroxisomes 0,004 anchovy * 0,003 x100 0,002 Peroxisomes in anchovy 0,001 0 Male North Male South Female North Female South
2.- Exposure and effect biomarkers Lysosomal membrane stability β-Gus (x 40) Hake Anchovy acid phosphatase 10 anchovy 8 6 2004 Lp (min) 2005 4 2 0 Female South Male South Female North Male North
3.- Liver and gonad histopathology Hake liver: Nematodes Inflammation Melanomacrophages Nuclear polymorphism
3.- Liver and gonad histopathology 2003 Hake liver: MF PA AB Nematodes (macroscopic) 40.2% (n=102) 10.7% (n=28) 37.5% (n=24) Nematodes (microscopic) 13.2% (n=68) 7.1% (n=28) 4.3% (n=23) MMCs 48.5% (n=68) 25% (n=28) 47.8% (n=23) IRLA 14.7% (n=68) 17.9% (n=28) 4.3% (n=23) HNP 16.2% (n=68) 50% (n=28) 30.4% (n=23) Necrotic Foci 3% (n=68) 0% (n=28) 0% (n=23) MMCs: melanomacrophage centers IRLA: inflammatory response with lymphocyte accumulations HNP: hepatocellular nuclear polymorphism Different colour indicates p<0.05 according to 2 test
3.- Liver and gonad histopathology Anchovy liver: Nematodes Nuclear polymorphism MMCs and coccideans Inflammation
3.- Liver and gonad histopathology Anchovy liver: SOUTH 2003 2004 Nematodes (microscopic) 46% (n=50) 0% (n=59) p<0.05 Coccideans 22% (n=50) 10.2% (n=59) p<0.05 MMCs 52% (n=50) 11.9% (n=59) p<0.05 IRLA 10% (n=50) 1.7% (n=59) p<0.05 HNP 16% (n=50) 13.5% (n=59) - Necrotic Foci 8% (n=50) 0% (n=59) p<0.05 MMCs: melanomacrophage centers IRLA: inflammatory response with lymphocyte accumulations HNP: hepatocellular nuclear polymorphism
3.- Liver and gonad histopathology hake gonad histopathology (prevalence of atretic oocytes) Degeneration of immature oocytes Alveolo cortical atretic oocytes vitellogenic atretic oocytes
3.- Liver and gonad histopathology anchovy gonad histopathology (prevalence of atretic oocytes) Atretic oocytes
3.- Liver and gonad histopathology hake average of inmature gonadal maturity (n=96) degenerated oocytes Vitellogenic (n=10) 2,50 Cortical alveoli (n= 18) 2,25 Previtellogenic primary growth (n=68) 1,48 stereological methods (Weibel lattice M168), 30 individuals, 20 fields, x 20 Checking of gonad histological samples since 1996
4.- Biochemical and nucleic acid analysis, growth rates and K index in anchovy larvae K condition index <5 6-10 10-15 15-20 > 20 2000 0.012 0.010 0.015 0.019 0.020 2003 0.016 0.014 0.018 0.020 0.023 t student (p) 0.043 0.003 0.021 0.547 0.127 days 25.0 2000 2003 ANCOVA, p> 0,05 20.0 y = 0.6517x + 2.8199 2 = 0.8731 R 15.0 SL (mm) 10.0 y = 0.5456x + 3.7933 2 R = 0.8653 5.0 0.0 0 5 10 15 20 25 30 Age (days) - Somatic condition - RNA/DNA (average) R/D2000=5 No significant differences (ANOVA p>0,05) R/D2003=4,7 - Growth rate
4.- Biochemical and nucleic acid analysis, growth rates and K index in anchovy larvae 1,6 1,8 2 2,2 2,4 2,6 2,8 100 100 90 90 80 80 70 70 60 60 50 50 40 40 30 30 20 20 10 10 0 0 BEFORE THE SPILL (2000,2001) n=118, p<.0001 Proteins % = -46,628 + 47,024 * ln(length+1); R^2 = ,326 Carbohydrates % = 54,574 - 19,323 * ln(length+1); R^2 = ,17 Lipids % = 92,054 - 27,701 * ln(length+1); R^2 = ,164 % Biomolecule AFTER THE SPILL (2003,2004) 1,6 1,8 2 2,2 2,4 2,6 2,8 Ln (legth mm+1) n=47, p>.05 % Biomolecule Proteins % = 23,44 + 12,754 * ln(length+1); R^2 = ,056 Carbohydrates % = 16,715 - 3,598 * ln(length+1); R^2 = ,04 Lipids % = 59,845 - 9,156 * ln(length+1); R^2 = ,025 Ln (legth mm+1)
5.- Fecundity analysis Anchovy Batch Fecundity: (total number of eggsreleased in a batch) Spawning fraction (%): percentage of spawning mature females -nothing extraordinary after the Prestige oil Spill
5.- Fecundity analysis Hake Relative Batch Fecundity (total number of hydrated oocytes/female gutted weight) -nothing extraordinary after the Prestige oil Spill
Summary-1 • In 2004 the concentration of 24 PAHs in flesh was higher in anchovy than in hake. Negative correlation between PAHs concentration and length in hake. • There were no differences in anchovy between years 2004 and 2005 in EROD activity and in LP. The volume density of Peroxisomas and AOX activity was decreased from 2004 to 2005. Could indicate recovery?? • - Prevalence of histopathologies in anchovydecreased from 2003 to 2004, indicating a possible recovery of their health state. High prevalence (>40% in some cases) of parasitic infestations, melanomacrophages, inflammatory reactions, necrotic foci and hepatocellular nuclear polymorphismin hake.
Summary-2 - The stereological preliminary results in 2004 show a 7.2% of atretic oocytes in hake and 0,26% in anchovy. It is necessary to check the historical series in order to test if there are significant differences between years. • In anchovy larvae, no significant differences between 2000 and 2003 in growth rate and nucleic acid analysis have been found. The somatic index differed only in the younger larvae. Different pattern of biomolecular composition before and after spill- There are no apparent differences in the annual fecundity for both species. Statistical comparative test among years and more biological parameters (size at maturity, duration of reproductive season…)are necessary to decipher whether there are differences in the reproductive capacity of populations.