Download
1 / 23
230 likes | 237 Views
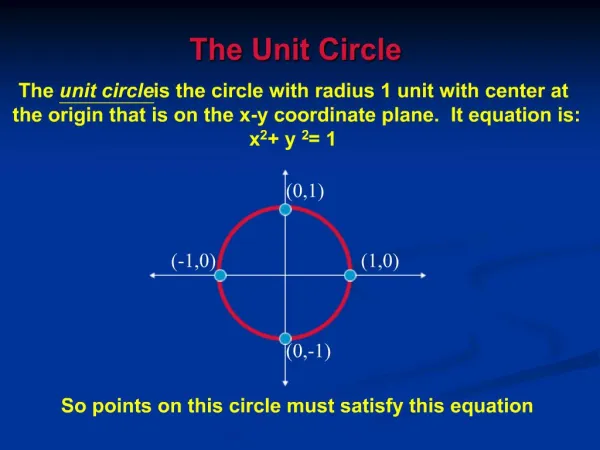
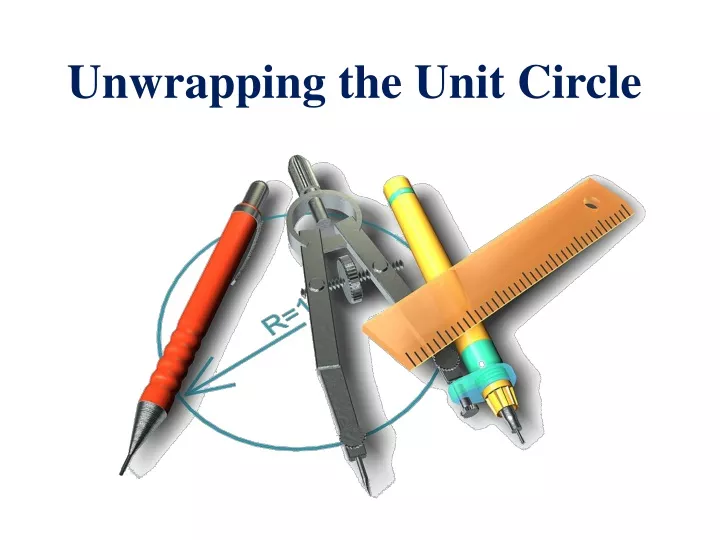
Unwrapping the Unit Circle. Essential Question: What are the graphs of the sine and cosine functions?. Enduring Understanding: Know the characteristics of the sine graph and cosine graph. Materials needed: Paper Compass Protractor Ruler Markers Pencil.

E N D
Essential Question: What are the graphs of the sine and cosine functions? Enduring Understanding: Know the characteristics of the sine graph and cosine graph.
Materials needed: • Paper • Compass • Protractor • Ruler • Markers • Pencil
Approximately 2-3 cm from the left edge of the paper draw a tick mark on the fold.
With your pencil point on the tick mark and the compass point on the fold line, draw a circle. Use your pencil to mark a dot in the center of the circle.
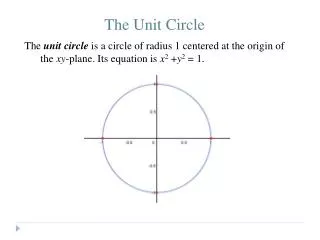
Using your ruler draw both a horizontal axis and a vertical axis intersecting at the center of the circle. Extend both axes 1-2 cm beyond the edge of the circle.
Since this is a unit circle, make a tick mark at each intersection point of the axes and the circle. Then label the tick marks accordingly. 1 -1 1 -1
Using your protractor, make a small tick mark every 15° from 0° to 360° around the circle. Label the tick marks on the outside of the circle. 1 45° 30° 15° -1 1 0° -1
Approximately 2 cm from the right side of the horizontal axis, draw a 48 cm horizontal line on the fold line. 1 -1 1 -1 On the left side of this line, draw a vertical line at least the same length as the vertical axis on the circle.
On the new vertical axis, draw a tick mark for 1 and -1 directly across from those on the vertical axis of the circle. Label similarly. 1 1 -1 -1 -1
Beginning at the intersection point of the new axes, draw a tick mark every 2 cm and label in 15°-increments from 0° to 360°. 1 1 -1 1 0° 15° 30° 45° 60° ------------------------------------------------------------------------------360° -1 -1
The graph of the sine function. Remember that on a unit circle, the sine of the angle is the vertical of the reference triangle
For each angle on the circle, using your ruler measure the vertical length from the horizontal axis to the point corresponding to that angle. 1 1 45° 30° 15° -1 1 0° 0° 15° 30° 45° 60° ------------------------------------------------------------------------------360° -1 -1 Then draw a line segment the same length above the corresponding tick mark in the coordinate plane on the right.
Continue this process for each angle of the circle from 0° to 360°. 1 1 45° 30° 15° -1 1 0° 0° 15° 30° 45° 60° ------------------------------------------------------------------------------360° -1 -1 Notice that after 180° the vertical segment is below the horizontal axis indicating a negative value. The segment should be drawn similarly in the coordinate plane on the right after 180° as well.
After you have completed the process from 0° to 360°, use your pencil to “smoothly” connect the dots at the far ends of the segments 1 1 -1 1 0° 15° 30° 45° 60° ------------------------------------------------------------------------------360° -1 -1 This curve is the graph of the sine function.
Sketch the Sine Graph below. 1 -360° -270° -180° -90° 0° 90° 180° 270° 360° -2 -3/2 - -/2 0 /2 3/2 2 -1 Domain: Range:
The graph of the cosine function. Remember that on a unit circle, the cosine of the angle is the horizontal of the reference triangle
For each angle on the circle, using your ruler measure the horizontal length from the vertical axis to the point corresponding to that angle. 1 1 45° 30° 15° -1 1 0° 0° 15° 30° 45° 60° ------------------------------------------------------------------------------360° -1 -1 Then draw a vertical line segment the same length above the corresponding tick mark in the coordinate plane on the right.
Continue this process for each angle of the circle from 0° to 360°. 1 1 45° 30° 15° -1 1 0° 0° 15° 30° 45° 60° ------------------------------------------------------------------------------360° -1 -1 Notice that after 90° to 270° the segments are to the left of the vertical axis. These segments represent negative values so the segments should be drawn below the x-axis in the coordinate plane on the right.
After you have completed the process from 0° 1o 360°, use your pencil to “smoothly” connect the dots at the far ends of the segments 1 1 -1 1 0° 15° 30° 45° 60° ------------------------------------------------------------------------------360° -1 -1 This curve is the graph of the cosine function.
Sketch the Cosine Graph below. 1 -360° -270° -180° -90° 0° 90° 180° 270° 360° -2 -3/2 - -/2 /2 3/2 2 -1 Domain: Range: