Download
1 / 19
740 likes | 2.64k Views
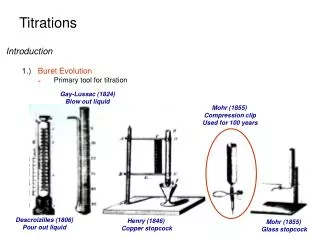
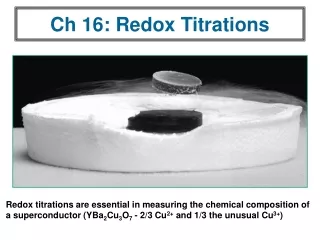
Redox Titrations. Introduction 1.) Redox Titration Based on an oxidation-reduction reaction between analyte and titrant Many common analytes in chemistry, biology, environmental and materials science can be measured by redox titrations. Electron path in multi-heme active site of P460.

E N D
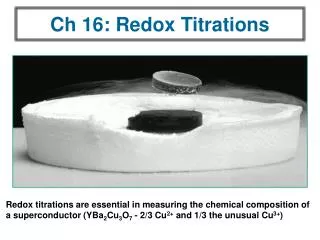
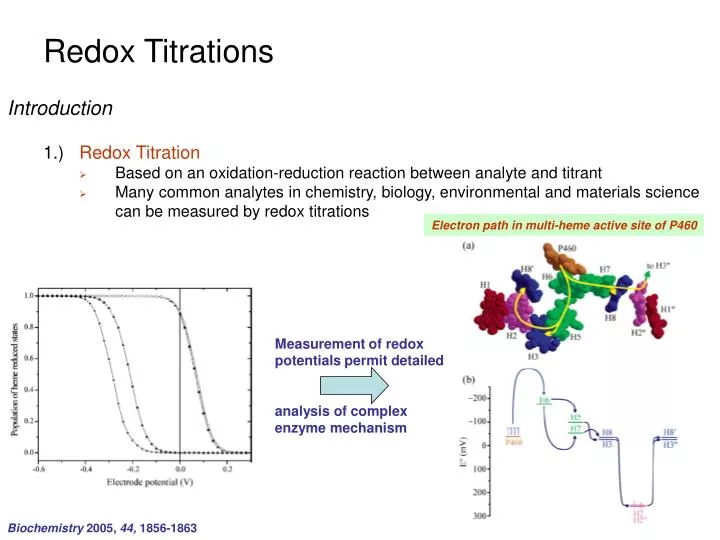
Redox Titrations • Introduction • 1.)Redox Titration • Based on an oxidation-reduction reaction between analyte and titrant • Many common analytes in chemistry, biology, environmental and materials science can be measured by redox titrations Electron path in multi-heme active site of P460 Measurement of redox potentials permit detailed analysis of complex enzyme mechanism Biochemistry 2005, 44, 1856-1863
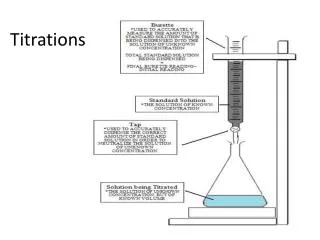
Redox Titrations • Shape of a Redox Titration Curve • 1.)Voltage Change as a Function of Added Titrant • Consider the Titration Reaction (essentially goes to completion): • Ce4+ is added with a buret to a solution of Fe2+ • Pt electrode responds to relative concentration of Fe3+/Fe2+ & Ce4+/Ce3+ • Calomel electrode used as reference K ≈ 1016 Indicator half-reactions at Pt electrode: Eo = 0.767 V Eo = 1.70 V
Redox Titrations • Shape of a Redox Titration Curve • 2.)Titration Curve has Three Regions • Before the Equivalence Point • At the Equivalence Point • After the Equivalence Point 3.) Region 1: Before the Equivalence Point • Each aliquot of Ce4+ creates an equal number of moles of Ce3+ and Fe3+ • Excess unreacted Fe2+ remains in solution • Amounts of Fe2+ and Fe3+ are known, use to determine cell voltage. • Residual amount of Ce4+ is unknown
Redox Titrations • Shape of a Redox Titration Curve 3.) Region 1: Before the Equivalence Point Use iron half-reaction relative to calomel reference electrode: Eo = 0.767 V Potential of calomel electrode Simplify
Redox Titrations • Shape of a Redox Titration Curve 3.) Region 1: Before the Equivalence Point • Special point when V = 1/2 Ve Log term is zero The point at which V= ½ Ve is analogous to the point at which pH = pKa in an acid base titration
Redox Titrations • Shape of a Redox Titration Curve 3.) Region 1: Before the Equivalence Point • Another special point, when [Ce4+]=0 • Voltage can not be calculated • [Fe3+] is unknown • If [Fe3+] = 0, Voltage = -∞ • Must be some Fe3+ from impurity or Fe2+ oxidation • Voltage can never be lower than value need to reduce the solvent Eo = -0.828 V
Redox Titrations • Shape of a Redox Titration Curve 3.) Region 1: Before the Equivalence Point • Special point when V = 2Ve Log term is zero The point at which V= 2 Ve is analogous to the point at which pH = pKa in an acid base titration
Redox Titrations • Shape of a Redox Titration Curve 4.) Region 2: At the Equivalence Point • Enough Ce4+ has been added to react with all Fe2+ • Primarily only Ce3+ and Fe3+ present • Tiny amounts of Ce4+ and Fe2+ from equilibrium • From Reaction: • [Ce3+] = [Fe3+] • [Ce4+] = [Fe2+] • Both Reactions are in Equilibrium at the Pt electrode
Redox Titrations • Shape of a Redox Titration Curve 4.) Region 2: At the Equivalence Point • Don’t Know the Concentration of either Fe2+ or Ce4+ • Can’t solve either equation independently to determine E+ • Instead Add both equations together Add Rearrange
Redox Titrations • Shape of a Redox Titration Curve 4.) Region 2: At the Equivalence Point • Instead Add both equations together Log term is zero Cell voltage Equivalence-point voltage is independent of the concentrations and volumes of the reactants
Redox Titrations • Shape of a Redox Titration Curve 5.) Region 3: After the Equivalence Point • Opposite Situation Compared to Before the Equivalence Point • Equal number of moles of Ce3+ and Fe3+ • Excess unreacted Ce4+ remains in solution • Amounts of Ce3+ and Ce4+ are known, use to determine cell voltage. • Residual amount of Fe2+ is unknown
Redox Titrations • Shape of a Redox Titration Curve 5.) Region 3: After the Equivalence Point Use iron half-reaction relative to calomel reference electrode: Eo = 1.70 V Potential of calomel electrode Simplify
Redox Titrations • Shape of a Redox Titration Curve 6.) Titration Only Depends on the Ratio of Reactants • Independent on concentration and/or volume • Same curve if diluted or concentrated by a factor of 10
Redox Titrations • Shape of a Redox Titration Curve 7.) Asymmetric Titration Curves • Reaction Stoichiometry is not 1:1 • Equivalence point is not the center of the steep part of the titration curve Titration curve for 2:1 Stoichiometry 2/3 height
Redox Titrations • Finding the End Point 1.) Indicators or Electrodes • Electrochemical measurements (current or potential) can be used to determine the endpoint of a redox titration • Redox Indicator is a chemical compound that undergoes a color change as it goes from its oxidized form to its reduced form
Redox Titrations • Finding the End Point 2.) Redox Indicators • Color Change for a Redox Indicator occurs mostly over the range: where Eo is the standard reduction potential for the indicator and n is the number of electrons involved in the reduction For Ferroin with Eo = 1.147V, the range of color change relative to SHE: Relative to SCE is:
Redox Titrations • Finding the End Point 2.) Redox Indicators • In order to be useful in endpoint detection, a redox indicator’s range of color change should match the potential range expected at the end of the titration. Relative to calomel electrode (-0.241V)
Redox Titrations • Common Redox Reagents 1.) Adjustment of Analyte Oxidation State • Before many compounds can be determined by Redox Titrations, must be converted into a known oxidation state • This step in the procedure is known as prereduction or preoxidation • Reagents for prereduction or preoxidation must: • Totally convert analyte into desired form • Be easy to remove from the reaction mixture • Avoid interfering in the titration • Potassium Permanganate (KMnO4) • Strong oxidant • Own indicator pH ≤ 1 Titration of VO2+ with KMnO4 Eo = 1.507 V Violet colorless pH neutral or alkaline Eo = 1.692 V Violet brown Before Near After Equivalence point pH strolngly alkaline Eo = 0.56 V Violet green
Redox Titrations • Common Redox Reagents 2.) Example • A 50.00 mL sample containing La3+ was titrated with sodium oxalate to precipitate La2(C2O4)3, which was washed, dissolved in acid, and titrated with 18.0 mL of 0.006363 M KMnO4. • Calculate the molarity of La3+ in the unknown.