Download
1 / 22
220 likes | 360 Views
Web Metrics. October 26, 2006 Steven Schwartz President, PowerWebResults.com Southeastern Massachusetts E-Commerce Network University of Massachusetts – Dartmouth. Agenda. Terms Definition Approach Making Sense of the Data Moving from Web Metrics to Web Analytics Tools Resources Q&A.

E N D
Web Metrics October 26, 2006 Steven Schwartz President, PowerWebResults.com Southeastern Massachusetts E-Commerce NetworkUniversity of Massachusetts – Dartmouth
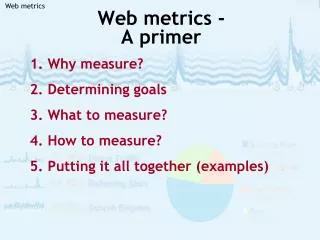
Agenda • Terms Definition • Approach • Making Sense of the Data • Moving from Web Metrics to Web Analytics • Tools • Resources • Q&A
Definitions • Hits: Connections made via the internet to another website • Unique Visitors: Individuals who visited your site during the report period (typically 30 days). If someone visits more than once, they are counted only the first time they visit. Counted by domain names, visitor id or cookie. (Unless they delete cookies) • Number of Visits: Number of time the unique visitor came to your site. • Pageviews: A measure of how many times a complete page is displayed. Metric: Average number of pages per visit
Definitions • Robots/Spiders - Automated software program that runs at many search engines, reads sites' content, analyzes it, and inserts them into the index (or collects information for later insertion into the index). • Entry/Exits – Point where people entered and exited the site • Paths – What were the most common pathways people used to navigate the site.
Strategy • What is the objective of your site? • Distribute information to customers/prospects • Capture Leads • Support Customers • Sell Stuff • Build Networks/Improve Relationships • ROI • Measure Your Results • Proof • KPIs – Key Performance Indicators
Conversions • Conversion is the number of visitors who took a desired action on your site • Buy Something • Download • Filled out a form • Conversion Rate = Desired Action /Total Number of Visitors (Typically 1 month) • For example, if 1,000 unique visitors were driven to your website from a search engine and 10 elected to purchase a product then your “sales” conversion rate would be 1.0%.
What Can Metrics Tell You • Overall health of the site • Direct improvements to your site • Improving Conversions • UI • Fine tune PPC campaigns/Landing Pages • Make decisions about direction and how to focus resources • Targeted Campaigns (email, advertising, webinars, sales) • Driving More Traffic • Search Optimization • PPC • Developing testing scenarios
Basic Questions • Unique Visitors – where do they come from • How People Find You (Drive Traffic) • Search optimization • People who link to you • What sources are most important • What do visitors do when they arrive? • Where do they enter? • Where do they leave? • How long do they spend on each page? • What are the most popular pages? • Do they go where you’d expect? (conversions)
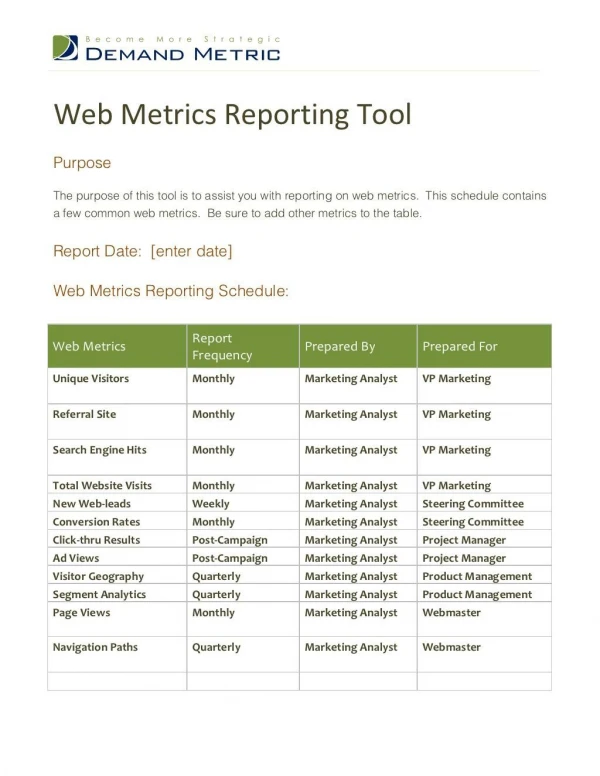
Measures to Look At • # of Unique Visitors • Trends over time • Time of Day • Look at Days of the week • Visit Duration • Top 10 Pages (Most popular pages) • How people find you? • What search phrase visitors use to find you • Entry/Exits • Navigation Pathways
Tools • ISP/Host May Offer for Free • Log Files on Web Server • AW-Stats – (Free) • Google Analytics (Free by Signup) • Net Tracker - Unica • Click Tracks • Web Trends
Key Performance Indicators • Analyze • Improve • Turn web metrics into meaningful information
Primary Performance Metrics • Conversion rates • Cost per visitor • Cost per lead, prospect or referral • Cost per customer • Value per visitor Source: Five Performance Metrics by Kevin Gold
Define Your Conversions • Conversion is the number of visitors who took a desired action on your site • Buy Something • Download • Filled out a form • Conversion Rate = Desired Action /Total Number of Visitors (Typically 1 month) • For example, if 1,000 unique visitors were driven to your website from a search engine and 10 elected to purchase a product then your “sales” conversion rate would be 1.0%. Source: Five Performance Metrics by Kevin Gold
Cost Per Visitor • Dollar amount spent to drive one unique visitor to your website. • For example, if you spent $100 to drive 1,000 unique visitors to your website, then your cost per visitor is $0.10. • Cost per Visitor = Money Spent / Total Number of Visitors Source: Five Performance Metrics by Kevin Gold
Cost per Lead/Referral • “Cost per visitor” times the number of unique visitors needed to produce one prospect, lead or referral. • For example, if you spent $100 to drive 1,000 unique visitors to your website and it produced 10 prospects; your “cost per prospect” is $10. • Cost per Lead = Money Spent / Total Number of Leads Produced Source: Five Performance Metrics by Kevin Gold
Cost Per Customer • “Cost per visitor” times the number of unique visitors needed to produce a sale. • For example, if you spent $100 to drive 1,000 unique visitors to your website and it produced 2 sales; your “cost per customer” is $50. • Cost Per Customer= Cost / # Customers Source: Five Performance Metrics by Kevin Gold
Value per Visitor • Composite figure that consists of multiple, performance metrics including conversion rate, average value per completed action, number of unique visitors and number of completed actions. • For example, if the 1,000 unique visitors generated 2 sales worth $100 per sale or $200 in gross revenue then your “value per visitor” is $0.20. • Value per Visitor = Sales / Total Number of Visitors • “cost per visitor” of $0.10 and your average “value per visitors $0.20 then for each new visitor you will gain $0.10 in gross profit. Source: Five Performance Metrics by Kevin Gold
Resources • Web Analytics Association • Google Analytics: Conversion University • MarketingProfs.com • ClickZ • Marketing Sherpa • Five Performance Metrics of Successful Online Business
Q & A Steven Schwartz PowerWebResults.com info@powerwebresults.com (401)440-4028
Conclusion • If you’re not looking at your web metrics, you should • Improve Conversions • Improve Site UI • Drive More Traffic • Make Educated Business Decisions