Download
1 / 26
260 likes | 374 Views
Using satellite measurements of stellar scintillation for mapping turbulence in the stratosphere. V. F. Sofieva (1) , A.S. Gurvich (2) , F. Dalaudier (3) , and the GOMOS team (4) (1) Finnish Meteorological Institute, Helsinki, Finland

E N D
Using satellite measurements of stellar scintillation for mapping turbulence in the stratosphere V. F. Sofieva(1), A.S. Gurvich(2), F. Dalaudier(3), and the GOMOS team(4) (1) Finnish Meteorological Institute, Helsinki, Finland (2) A.M. Oboukhov Institute of Atmospheric Physics, Moscow, Russia (3) LATMOS (Service d’Aeronomie du CNRS), France (4) FMI, Finland; Service d’Aeronomie, France; IASB, Belgium, ACRI-ST, France, ESA/ESRIN, Italy; ESA/ESTEC, Netherlands
Outlines • Methodology: using space-borne stellar scintillation measurements for studies of small-scale processes in the atmosphere • Application: results of analysis of GOMOS/Envisat scintillation measurements Turbulent mixing and beyond, ICTP, Trieste, 3 August 2009
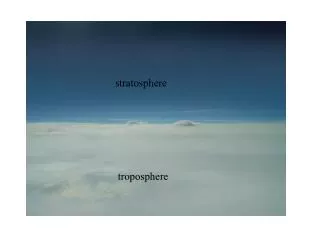
Atmospheric layers Stratosphere www.singularvortex.com Turbulent mixing and beyond, ICTP, Trieste, 3 August 2009
Introduction • Gravity waves, their generation, propagation and breaking • Global effects of (relatively) small-scale gravity waves • influence the stratospheric circulation • affect ice cloud formation and polar ozone loss • they play an important role in driving atmospheric circulations (including quasi-biennial oscillation) • play an important role in controlling temperatures in the Antarctic ozone hole • Satellite observations of stellar scintillations is the new approach for study of small-scale processes in the atmosphere Turbulent mixing and beyond, ICTP, Trieste, 3 August 2009
Scintillation of stars Turbulent mixing and beyond, ICTP, Trieste, 3 August 2009
Twinkle, twinkle Scintillation of stars: a simplified qualitative explanation direction of the light Turbulent mixing and beyond, ICTP, Trieste, 3 August 2009
Past and present space-borne stellar scintillation measurements • Past: • EFO-2 photometer, Russian MIR station (1996-1999) • Sampling frequency up to 16 kHz • Central wavelength 485 nm • Man-controlled photometer (~100 occultations, within 60° latitudinal band) • Present: scintillation measurements by GOMOS fast photometers (since March 2002) • First bi-chromatic scintillation measurements • Blue 470-520 nm • Red 650-700 nm • Sampling frequency 1 kHz • Global coverage • Objectives • Scintillation correction of spectrometer data • High resolution temperature profile • Small scale structures of air density, stratospheric dynamics EFO-2 fast photometer GOMOS fast photometer Turbulent mixing and beyond, ICTP, Trieste, 3 August 2009
GOMOS measurements movie Turbulent mixing and beyond, ICTP, Trieste, 3 August 2009
General strategy for retrieval of information about air density irregularities • 3D distribution from 1D scintillation measurements? • The problem is severely ill-posed • Approach proposed in [Gurvich and Kan, 2003] • 1 step. The spectrum of the air density irregularities is parameterized • 2 step. 3D-spectrum of air density irregularities 1d-scintillation spectrum at observation point (The theoretical relations are found) • 3 step. The parameters of the spectral model are retrieved via fitting experimental scintillation spectra Turbulent mixing and beyond, ICTP, Trieste, 3 August 2009
Structure of air density irregularities • Anisotropic irregularities • Elongated in horizontal direction • Generated by internal gravity waves • Isotropic irregularities (turbulence) • Result from breaking of internal gravity waves • Dynamic instabilities • Two-component spectral model of relative fluctuations of air density anisotropic isotropic Turbulent mixing and beyond, ICTP, Trieste, 3 August 2009
Spectrum of anisotropic irregularities • corresponds to anisotropic irregularities generated by a random ensemble of internal gravity waves • CW is the structure characteristic • is the anisotropy coefficient • 2/0 is the outer scale • 2/W is the inner scale • The associated 1D vertical spectrum for 0 << z << Wcorresponds to the model of the saturated gravity waves Turbulent mixing and beyond, ICTP, Trieste, 3 August 2009
Spectrum of isotropic irregularities • Spectrum of locally isotropic turbulence (Kolmogorov model) • CK is the structure characteristic • K is the wavenumber corresponding to inner scale of isotropic irregularities (Kolmogorov scale) • The corresponding 1D spectrum follows well-known -5/3 power law • Individual turbulent patches are not resolved, CK represents the effective value in the region of interaction of light wave and the turbulent atmosphere Turbulent mixing and beyond, ICTP, Trieste, 3 August 2009
Model of 1D vertical spectra of air density irregularities 0 K Turbulent mixing and beyond, ICTP, Trieste, 3 August 2009
Modelled scintillation spectra • Stratospheric distortion of light rays • Distortion of optical path (eikonal) • Frozen field assumption • Phase screen approximation • Scintillation spectrum (weak scintillation) 3d spectrum of air density irregularities Fn(kx, ky, kz) 2d spectrum of eikonal fluctuations F(ky, kz) 2d spectrum of scintillation 1d spectrum of scintillation Turbulent mixing and beyond, ICTP, Trieste, 3 August 2009
Scintillation spectra in phase screen approximation (weak scintillation) eikonal fluctuations on phase screen plane 2D spectrum of yon phase screen plane (Gurvich, 1984) 2D spectrum of observed light flux on observation plane VJ is 1D spatial scintillation spectrum in observation plane Turbulent mixing and beyond, ICTP, Trieste, 3 August 2009
Scintillation spectra Turbulent mixing and beyond, ICTP, Trieste, 3 August 2009
The main approach to scintillation analysis • To separate the anisotropic and isotropic components • To retrieve essential parameters of IGW and turbulence spectra Turbulent mixing and beyond, ICTP, Trieste, 3 August 2009
Inversion • Vmeas=CKViso+CWVaniso(W, 0)+ • Maximum likelihood method, which is equivalent to minimization of • Combination of linear and non-liner optimization • Non-linear fit (Levenberg-Marquardt) for W and 0 • Linear fit (weighted least-squares method) for CK and CW Turbulent mixing and beyond, ICTP, Trieste, 3 August 2009
Filtering quasi-periodic structures Turbulent mixing and beyond, ICTP, Trieste, 3 August 2009
Examples of retrievals : 1.photometer data Turbulent mixing and beyond, ICTP, Trieste, 3 August 2009
Examples of retrievals: moderate turbulence Sofieva et al., JGR, 2007 R02908/S001 (=67, 35S, 106W, 20 September 2002) Turbulent mixing and beyond, ICTP, Trieste, 3 August 2009
Examples of retrievals: strong turbulence Sofieva et al., JGR, 2007 R07741/S001 (=40, 62S, 7E, 23 August 2003) Turbulent mixing and beyond, ICTP, Trieste, 3 August 2009
Indication on gravity wave breaking in polar night jet • Qualitative: Sofieva et al. (2007), Global analysis of scintillation variance: Indication of gravity wave breaking in the polar winter upper stratosphere, Geophys. Res. Lett., 34, L03812, doi:10.1029/2006GL028132 Jan-Mar, Dec 2003 June-Sep 2003 Gravity wave structure characteristic CW(m-2) Turbulence structure characteristic CT2(K2m-2/3) Sofieva et al., GRL, 2009 latitude latitude Turbulent mixing and beyond, ICTP, Trieste, 3 August 2009
CT2 in tropics (at 42 km) • Turbulence intensity is smaller in tropics than in polar regions; it has a pronounced zonal structure • Average values of CT2 follow the sub-solar latitude • Almost all of the local enhancements are over continents • Many of enhancements correspond well to the typical regions of deep convection • No systematic increase of CT2 over large mountain regions is observed Gurvich et al., 2007, GRL Turbulent mixing and beyond, ICTP, Trieste, 3 August 2009
Evolution of CT2 at 80 N during the sudden stratospheric warming in December 2003 Sofieva et al., (2007): Reconstruction of internal gravity wave and turbulence parameters in the stratosphere using GOMOS scintillation measurements, Journal of Geophys. Res., 112, D12113, doi:10.1029/2006JD007483 Turbulent mixing and beyond, ICTP, Trieste, 3 August 2009
Summary, discussion, future work • The presented results are the start in studying small-scale air density irregularities • Strength of scintillation method: • It covers the wavenumber range of transition of GW spectrum to turbulence -> possibility of visualizing GW breaking • Scintillation are affected by small-vertical-scale GW -> importance for GW parameterizations in GCM models • Other measurements at such small vertical resolution are scarce in this altitude range • The processing of the 2002-Jan 2005 dataset has been recently completed, the data analyses are on-going Turbulent mixing and beyond, ICTP, Trieste, 3 August 2009