Download
1 / 43
430 likes | 625 Views
Section 1.1. 1. Write the interval [0, 6) in set notation and graph it on the real line. 1. { x | 0 ≤ x < 6}. Given the equation y = 5x – 12, how will y change if x: a. Increases by 3 units?. a. Since Δ x = 3 and m = 5, then Δy, the change in y, is Δ y = 3 • m = 3 • 5 = 15.

E N D
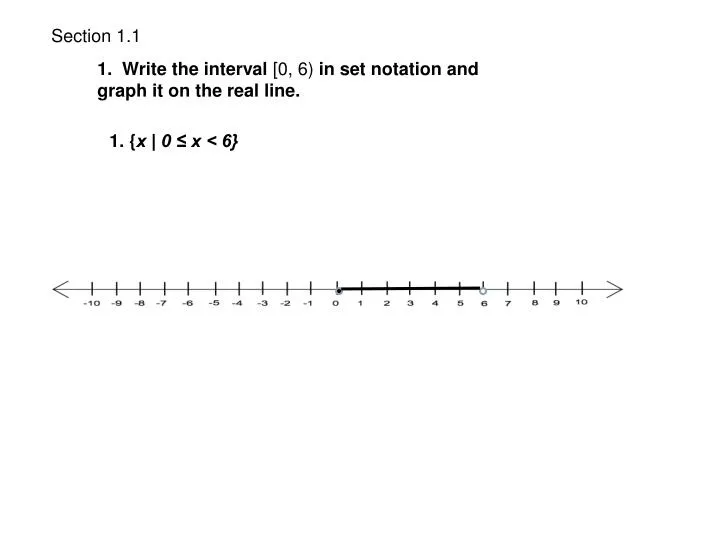
Section 1.1 1. Write the interval [0, 6) in set notation and graph it on the real line. 1. {x | 0 ≤ x < 6}
Given the equation y = 5x – 12, how will y change if x: • a. Increases by 3 units? a. Since Δx = 3 and m = 5, then Δy, the change in y, is Δy = 3 • m = 3 • 5 = 15 OR You want to find the change in y, y. But since m = y/ x you know that y = m · x. And in this problem m = 5 and x = 3 so y = 5 · 3 = 15 b. Since Δx = –2 and m = 5, then Δy, the change in y, is Δy = –2 • m = –2 • 5 = –10
3. Find the slope of the line determined by the following pair of points: (2, 3) and (4, 1). For (2, 3) and (4, 1), the slope is
4. Find the slope of the line determined by the following pair of points: (0, -1) and (4, -1). For (0, - 1) and (4, –1), the slope is
5. Find the slope m and y-intercept (0,b) (if they exist) and draw the graph. 2x – 3y = 12 First solve for y: Therefore, and y-intercept is (0, -4)
6. Find the slope m and y-intercept (0,b) (if they exist) and draw the graph. First solve for y: Therefore m = 1 and the y-intercept is (0,0)
7. Find the slope m and y-intercept (0,b) (if they exist) and draw the graph. First solve for y: Therefore, and the y-intercept is (0,-1).
8. Write an equation of the line satisfying the following conditions. If possible, write your answer in the form y = mx + b. Slope – 2.25 and y-intercept – 8. y = - 2.25x - 8
9. Write an equation of the line satisfying the following conditions. If possible, write your answer in the form y = mx + b. Slope 5 and passing through the point ( -1,-2)
10. Write an equation of the line satisfying the following conditions. If possible, write your answer in the form y = mx + b. Horizontal and passing through the point (1.5, -4) Note: y = b is a horizontal line
11. Write an equation of the line satisfying the following conditions. If possible, write your answer in the form y = mx + b. Vertical and passing through the point ( 1.5, - 4) Note: x = a is a vertical line.
12. Write an equation of the line satisfying the following conditions. If possible, write your answer in the form y = mx + b. Passing through the points (1, -1) and (5, -1) First, find the slope, Then use the point-slope formula with this slope and the point (1,-1).
13. Write an equation of the form y = mx + b for the following line. Note the y-intercept of 1 and a slope of - 2 y = - 2x + 1
14. Write an equation of the form y = mx + b for the following line. Note the y-intercept of - 2 and a slope of 2/3. y = 2/3 x - 2
15. Business: Energy Usage A utility considers demand for electricity “low” if it is below 8 mkW (million kilowatts, “average” if it is at least 8 mkW but below 20 mkW, “high” if it is at least 20 mkW but below 40 mkW, and “critical” if it is 40 mkW or more. Express these demand leverls in interval notation. [Hint: the interval for “low” is [0,8). Low demand: [0,8); Average demand: [8,20); High demand: [20,40); Critical demand: [40,∞)
16. Business: U.S. Computer Sales Recently, computer sales in the U.S. have been growing approximately linearly. In 2001 sales were 55.2 million units, and in 2006 sales were 75.7 million units. a. Use the first and last (Year, Sales) data points (1,55.2) and (6,75.7) to find the linear relationship y = mx + b between x = Years Since 2000 and y = Sales (in millions). b. Interpret the slope of the line. c. Use the linear relationship to predict sales in the year 2015. • To find the linear equation use the point slope form. First find the slope between the points. Next substitute the slope and one of the points into y – y 1 = m (x – x 1) y – 55.2 = 4.1 (x – 1) y = 4.1 x + 51.1
16. Business: U.S. Computer Sales Recently, computer sales in the U.S. have been growing approximately linearly. In 2001 sales were 55.2 million units, and in 2006 sales were 75.7 million units. b. Interpret the slope of the line. c. Use the linear relationship to predict sales in the year 2015. c. Use x = 15 in the equation for part a to find the answer for part c. y = (4.1) (15) + 51.1 = 112.6 million units.
17. • Business: Straight-Line Depreciation • Straight-line depreciation for estimating the value of an asset (such as a piece of machinery) as it loses value (“depreciates”) through use. Given the original price of an asset, its useful lifetime, and its scrap value (its value at the end of its useful lifetime), the value of the asset after t years is given by the formula: • A. A farmer buys a harvest for $50,000, and estimates its useful life to be 20 years, after which its scrap value will be $6000. Use the formula above to find a formula for the value of V of the harvest after t years, for 0 ≤ t ≤ 20. • B. Use your formula to find the value of the harvest after 5 years. • C. Graph the function found in part (a) on a graphing calculator on the widow [0,20] by [0,50,000]. [Hint: use x instead of t.] • Price = $50,000; useful lifetime = 20 years; • scrap value = $6,000. B. Substitute t = 5 into the equation. V = 50,000 – 2,200t = 50,000 – 2,200 (5) = 50,000 – 11,000 = $39,000 C. On [0,20] by [0,50,000] OR Use your graphing calculator in parts b and c.
Social Sciences: Smoking and Income Based on a recent study, the probability that someone is a smoker decreases with the person’s income. If someone’s family income is x thousand dollars, then the probability (expressed as a percentage) that the person smokes is approximately y = - 0.31x + 40 (for 10 ≤ t ≤ 100.) A. Graph the line on the window [0,100] by [0,50]. B. What is the probability that a person with a family income of $40,000 is a smoker? [Hint: Snce x is in thousands of dollars, what x-value corresponds to $40,000?] C. What is the probability that a person with a family income of $70,000 is a smoker? 18. OR Use your graphing calculator in parts b and c. B. To find the probability that a person with a family income of $40,000 is a smoker. Substitute 40 into the equation: or 28% A. on [0,100] by [0,50] C. The probability that a person with a family income of $70,000 is a smoker is or 18%
21. Evaluate Note: if you use a calculator for these problems your answer may be in decimal form and that is fine.
23. Evaluate 25 1/2 . Remember to enter it as 25 ^ (1/2) or 25 ^ (0.5)
31. Use a calculator to evaluate 7 0.39 Remember to enter it as 7 ^ 0.39 =
33. Use a calculator to evaluate .1 ^ .1 ^ .1 =
37. Simplify OR
38. 38. Allometry: Dinosaurs - The study of size and shape is called “allomerty”, and many allometric relationships involve exponents that are fractions or decimal. For example, the body measurements of most four-legged animals, from mice to elephants obey (approximately) the following power law: (Average body thickness) = 0.4 (hip-to-shoulder length) ^ (3/2) where body thickness is measured vertically and all measurements are in feet. Assuming that this same relationship held for dinosaurs, find the average body thickness of the following dinosaurs, whose hip-to-shoulder length can be measured from their skeletons: Diplodocus, whose hip-to-shoulder length was 16 feet. Average body thickness = 0.4(hip-to-shoulder length)3/2
39. 39. Business: The Rule of .6 Many chemical and refining companies use “the rule of point six” to estimate the cost of new equipment. According to this rule, if a piece of equipment (such as a storage tank) originally cost C dollars, then the cost of similar equipment that is x times as large will be approximately C dollars. For example, if the original equipment cost C dollars, then new equipment with twice the capacity of the old equipment (x=2) would cost dollars – that is, about 1.5 times as much. Therefore, to increase capacity by 100% coasts only about 50% more. Use the rule of .6 to find how costs change if a company wants to quadruple (x=4) its capacity. To quadruple the capacity costs about 2.3 times as much.
40. 40. Allometry: Heart Rate - It is well known that the hearts of smaller animals beat faster than the hearts of larger animals. The actual relationship is approximately Heart rate = where the heart rate is in beats per minute and the weight is in pounds. Use the relationship to estimate the heart rate of: a 16-pound dog. 250(weight)-1/4 (heart rate)= 250(weight)-1/4 = 250(16)-1/4 = 125 beats per minute
41. 41. Business: Learning Curves in Airplane Production - The learning curves for the production of Boeing 707 airplanes is (thousand work-hours) where n is the sequential number of the plane being built. Find how many work-hours it took to build: The 50th Boeing 707. (Time to build the 50th Boeing 707) =150(50)-0.322 ≈42.6 thousand work hours It took approx. 42,600 work-hours to build the 50th Boeing 707.
General: Speed and Skid Marks - Police or insurance investigators often want to estimate the speed of a car from the skid marks it left while stopping. A study found that for standard tires on dry asphalt, the speed in (mph) is given approximately by: • where x is the length of the skid marks in feet. (This information takes into account the declaration that occurs even before the car begins to skid.) Estimate the speed of a car if it left skid marks of: 150 feet. 42. = 60 miles per hour The speed of a car that left 150-foot skid marks was 60 miles per hour.