Download
1 / 29
290 likes | 418 Views
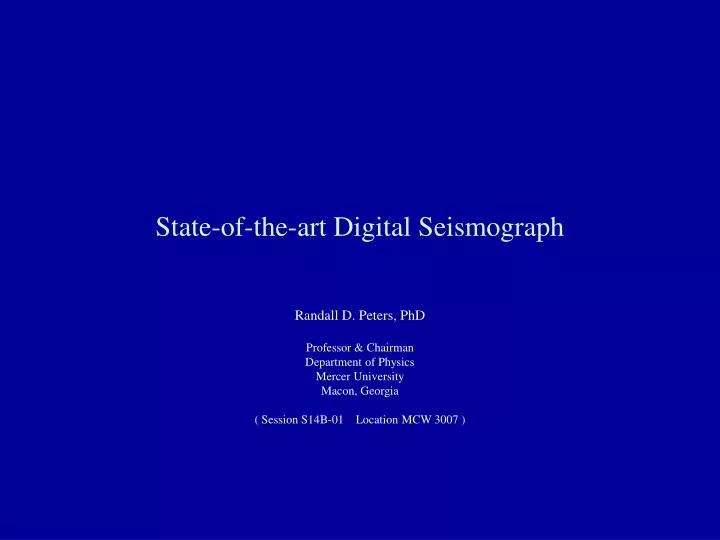
State-of-the-art Digital Seismograph. Randall D. Peters, PhD Professor & Chairman Department of Physics Mercer University Macon, Georgia ( Session S14B-01 Location MCW 3007 ). VolksMeter -- a seismometer / tiltmeter that evolved out of fundamental physics research.

E N D
State-of-the-art Digital Seismograph Randall D. Peters, PhD Professor & Chairman Department of Physics Mercer University Macon, Georgia ( Session S14B-01 Location MCW 3007 )
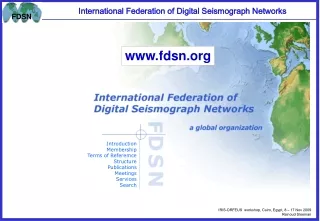
VolksMeter -- a seismometer / tiltmeter that evolved out of fundamental physics research The Instrument is being exhibited at this conference Business Partners: Les LaZar, Zoltech Corp. (Mechanical) Larry Cochrane, Webtronics (Electronics & Software)
One Example of Pendulum research spanning nearly two decades –Compound pendulum used to study Internal friction These studies discovered that Internal friction limits the performance of seismometers at low frequencies: Some relevant publications: (1) “Friction at the mesoscale”, Contemp. Phys. Vol. 45, No. 6 (2004) (2) Vibration and Shock Handbook, Chapters 20 & 21 on “Damping Theory” & “Experimental Techniques”, ed. C. W. de Silva, CRC (2005), (3) McGraw-Hill Encyclopedia of Science & Technology, articles on “Chaos (Math. Methods in Phys.)” & “Anharmonic Oscillator”.
Second example of a pendulum used in physics research(generically similar to instruments used in late 19th century) Simple pendulum used to study diurnal (non-tidal) signals continuously over an 18-month interval Early work was by George Darwin, Son of famous English biologist in Collaboration with physics great, Lord Kelvin
Close-up photograph of a SensorThe patented symmetric differential capacitive (SDC) sensor, operating on the basis of area-variation, rather than gap-spacing-variation, is one form of the first fully-differential capacitive sensorResolution: 0.4 nrad (0.1 nm), Dynamic range > 130 dB
Why was a simple compound pendulum chosen? • Superior mechanical stability. • Simple construction. • Simple precision calibration. • Easy to use. • Reduced mechanical sensitivity, previously unacceptable, overcome by latest electronics technology [SDC sensor plus capacitance to digital converter (CDC)].
Pendulum free-decay without damping magnets(illustrates sensor linearity—harmonic distortion below 60 dB)
Example connection--Fully-differential sensor (Peters patent U.S. 5,461,319) to the Capacitance-to-Digital-Converter(Analog Devices AD7745)
One key advantage of digital electronics VolksMeter with fully-digital electronics (1 / f 0.23) SDC sensor with synchronous detection ( 1 / f 0.72 ) SDC sensor without synchronous detection ( classic 1 / f )
VolksMeter Noise compared to earth background VolksMeter’sInstrument Equivalent Noise Power Spectral Density From Fig. 7, horizontal component only, J. Berger & P. Davis, J. Geophys. Res. Vol. 109, B11307 (2004).
Advantage of a position sensor over a conventional velocity sensor at low frequencies
Position sensor also takes advantage of a pendulum’s tilt response at low frequencies
Illustration of how the tilt response becomes increasingly significant as frequency decreases[ Tilt response of horizontal seismometers treated by P. W. Rodgers, “The response of the horizontal pendulum seismometer to Rayleigh and Love Waves, tilt, and free oscillations of the earth”, Bull. Seis. Soc. Amer., v. 58, no. 4, pp. 1385-1406 (1968).]
Response to local earthquakes (two events, same helicord) Power Spectral Density plot of first Earthquake of Mag. 4.5 (2nd earthquake Mag. 3.9) Helicord records -- each event 160 km northerly distant from instrument having N-S pendulum orientation
Comparison of Volksmeter teleseismic response to a commercial broadband instrument
Advantage of the Integrated signal for the real-time observation of teleseismic earthquakes
Illustration of difference in the time domain—raw data vs integrated signal
Illustration of the broadband features of the Volksmeter( response during demise of tropical storm Paul ) Helicord record, Instrument at Redwood City, CA Power Spectral Densities ( 32K points from pair of 6 h segments)
VolksMeter Operational AttributesTriad of features integrated in a uniquely synergetic package: • Latest technology (fully differential capacitive) sensor • Award-winning acquisition electronics • Powerful, user-friendly acquisition (WinSDR) and analysis (WinQuake) software (also compatible with USGS seismic recording package, “Earthworm”) • Providing good earthquake records, both local and teleseismic, while • Yielding a new window on the world of very-low-frequency earth motions and • Providing means to easily generate TRUE power spectral densities)
Example of WinQuake generated figures (records following storm passage)
Illustration of the ease with which filtering is done (here low-pass at 0.1 Hz)
Illustration of added-versatility through easy-exportation of data to Excel