Download
1 / 28
300 likes | 527 Views
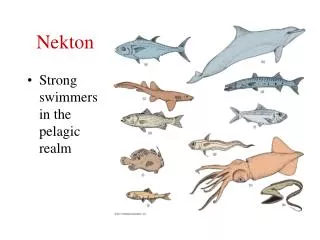
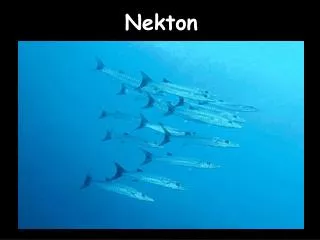
Marsh terracing as a restoration technique for creating nekton habitat. USGS Louisiana Cooperative Fish and Wildlife Research Unit School of Renewable Natural Resources Louisiana State University Agricultural Center Baton Rouge, LA. COASTAL RESTORATION.

E N D
Marsh terracing as a restoration technique for creating nekton habitat USGS Louisiana Cooperative Fish and Wildlife Research Unit School of Renewable Natural Resources Louisiana State University Agricultural Center Baton Rouge, LA
COASTAL RESTORATION • To restore and increase vegetated marsh and submerged aquatic vegetation habitat in terms of both quantity and quality • To increase fishery habitat in terms of area and quality
Field of dreams hypothesis: “if you build it, they will come”
MEASURING SUCCESS • Area of vegetated marsh created • Establishment of marsh vegetation • Functional equivalency • Habitat quality (density, standing stock) • Habitat suitability (species occurrence) • Food chain support (diet) • Fitness (condition or growth)
OBJECTIVES • Determine the effect of marsh terraces on adjacent water quality and sediment characteristics. • Compare nekton communities in paired terraced and unterraced ponds: • Density (habitat quality) • Community assemblages (habitat suitability) • Condition (fitness)
PREVIOUS TERRACE RESEARCH • Rozas and Minello 2001 • Maximize marsh edge • Bush Thom et al. 2004 • Differences in community composition
S R Site 3 Unit 7 (t) Unit 5 (u) Site 2 Unit 5 Site 1 Unit 4 STUDY SITES • Three sets of paired terraced and unterraced ponds (Rockefeller SWR (Sites 1 &2); Sabine NWR (Site 3)). • Sampling at three habitat types: 1) terraced marsh edge 2) unterraced marsh edge 3) open water • Sampled 7 times • bi-monthly April 2004 – April 2005 • 7 sample dates x 3 sites x 2 ponds x 4 sites = 168 samples
Terraced Pond • Two terraced edge (< 1m) • Two open water (> 50 m edge)
Unterraced Pond • Two unterraced edge (< 1m) • Two open water (> 50 m)
METHODS • Nekton • Samples were collected with a 1-m2 throw trap. A bar seine is used to clear all nekton from the trap.
METHODS • Water Quality & Soils • Depth and water quality data (salinity, conductivity, temp., D.O., turbidity) were collected along with each nekton sample. • Percent organic matter • SAV • All submerged aquatic vegetation was collected from the throw trap.
Habitat quality Compare water quality, nekton density, biomass, richness and diversity between terraced and unterraced edge and open water sites (ANOVA) Habitat Suitability Compare species composition (Chi-square) Nekton Condition Compare dominant species length-weight relationships (ANCOVA) STATISTICAL ANALYSES
RESULTS: ENVIRONMENTAL CHARACTERISTICS • Turbidity (P = 0.23) • lower in terraced ponds • SAV (P < 0.0001) • higher biomass in terraced ponds • *Soil Organic Matter (P = 0.003) • lower at terraced edge
FUNCTIONAL EQUIVALENCY TRAJECTORY Craft et al. 2003
45 40 35 30 25 Nekton Density (individuals/m2) 20 15 10 5 0 Edge Open water Edge Open water Terraced Unterraced Habitat Type
45 A 40 35 B 30 25 Nekton Density (individuals/m2) 20 15 10 5 0 Edge Open water Edge Open water Terraced Unterraced Habitat Type
A 45 A 40 35 30 25 Nekton Density (individuals/m2) 20 15 10 5 0 Edge Open water Edge Open water Terraced Unterraced Habitat Type
CONCLUSIONS • Habitat characteristics differed between terraced and unterraced ponds (SAV, organic matter, turbidity). • Habitat quality, as measured by nekton density and diversity, were similar between terraced and unterraced edges.
Terraced Unterraced NEKTON SPECIES COMPOSITION Daggerblade grass shrimp Rainwater killifish Inland silverside Sailfin molly Naked goby Blue crab Western mosquitofish Other n = 1,623 n = 1,921
Terraced Edge Unterraced Edge Crustaceans Demersal fish Benthopelagic fish Pelagic fish Terraced Open Water Unterraced Open Water Chi-sq: P < 0.0001
CONCLUSIONS • Habitat characteristics differed between terraced and unterraced ponds (SAV, organic matter, turbidity). • Habitat quality, as measured by nekton density and diversity were similar between terraced and unterraced edges. • Habitat suitability, as measured by species abundances and community composition, differed significantly between terraced and unterraced habitats with greater proportion of benthic dependent species at unterraced edge, and greater proportions of pelagic species in terraced habitats.
FISH CONDITION • Based on length / weight relationship • Heavier fish = better condition Lucania parva 0.0 log10(W) = a' + b × log10(L) -0.5 W' = aLb Kn = W / W' log10(weight) -1.0 -1.5 -2.0 0.0 0.1 0.2 0.3 0.4 0.5 0.6 0.7 log10(length)
Cyprinodon variegatus ANCOVA terraced unterraced
Inland silverside Sheepshead minnow Clown goby Condition (length-weight) Terraced Unterraced NSD • Rainwater killifish • Western mosquitofish • Naked goby • Sailfin molly
CONCLUSIONS • Habitat characteristics differed between terraced and unterraced ponds (SAV, organic matter, turbidity). • Habitat quality, as measured by nekton density was similar between terraced and unterraced edges. • Habitat suitability, as measured by species abundances and community composition, differed significantly between terraced and unterraced habitats. • Nekton fitness or health, as measured by length – weight relationships, was lower in terraced as compared to unterraced ponds for 3 species, and similar between terraced and unterraced ponds for 3 different species.
FUNCTIONAL EQUIVALENCY TRAJECTORY (Hobbs and Mooney 1993) Restoration Alternative states Complexity / function Stays the same Continued decline Time Plant biomass (3-5 yrs); benthic communities (10-15 yrs); soil properties (30 + years) (Craft et al. 1999, Craft 2003, Broome et al. 1986)
FUNCTIONAL EQUIVALENCY • Terraces do provide nekton habitat, largely through the provision of edge habitat. • However, ecological equivalency is clearly not achieved within 4 years of restoration (as measured in this project). • Species occurrence or abundance only provide a part of the picture - measures of species health and community assemblages need to be considered to fully capture the “value” of restored marshes.
Funding provided by CREST (Coastal Restoration and Enhancement through Science and Technology) • Thanks to Rockefeller SWR and Sabine NWR for access to sites, and logistical help. • Thanks to Chris Cannaday, Jessica O’Connell, Bryan Piazza, Tim Birdsong, and Seth Bordelon for assistance in the field.