Download
1 / 12
120 likes | 232 Views
ITALIA. LE CIFRE CHIAVE. GLI INVESTIMENTI DEL GRUPPO. 462. 465. 500. 464. 402. 33. 49. 105. 400. 89. 68. 104. 14. 8. 60. 64. 38. 38. 300. 15. 35. 9. 49. 28. 133. 145. 115. 200. 96. 103. 100. 163. 152. 130. 126. 0. 2004. 2005. 2006. 2007. Hyper. Super.

E N D
GLI INVESTIMENTI DEL GRUPPO 462 465 500 464 402 33 49 105 400 89 68 104 14 8 60 64 38 38 300 15 35 9 49 28 133 145 115 200 96 103 100 163 152 130 126 0 2004 2005 2006 2007 Hyper Super Proxi Cash Shopping malls Sede
L’EVOLUZIONE DELLA RETE 2006 2004 2005 55 39 51 38 50 -diretti -franchising 1 1 465 380 444 226 239 -diretti 154 205 -franchising 1.020 975 706 133 155 -diretti 573 820 -franchising 20 15 17 14 16 -diretti 1 1 -franchising ITALIE 1.560 1.140 1.487 411 460 -diretti 729 1.027 -franchising
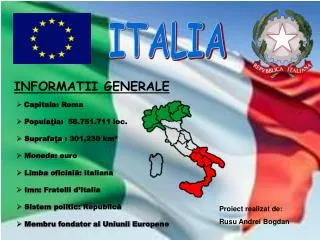
Per Carrefour… Il più alto potenziale di sviluppo in Europa dovuto al debole tasso di: • Concentrazione del commercio moderno • Sviluppo degli Ipermercati • Sviluppo degli HD … L’ Italia … • 58 Milioni di abitanti • Reddito medio di € 13.200/abitante • «Stile Italiano » - Moda - Cibo - Tecnologie - …
D vs 2004 Il RETAIL IN ITALIA Principali Gruppi della Grande Distribuzione Alimentare Quota PGC 2005% sul mercato Iper+Super+Proxi 15,4 10,4 10,0 8,9 7,6 7,1 7,0 3,4 (Source: ACNIELSEN)
HYPERMARCHES > 2500 mq IPERCOOP AUCHAN -0,3% CARREFOUR 0,5% SUPERSTORE ESSELUNGA 0,4% FINIPER -0,2% BENNET FAMILA - SELEX -0,4% PIANETA - CONAD PAM - PANORAMA IPERSTANDA - REWE D vs 2004 QUOTA DI MERCATO ANNO 2005 PER FORMATO 21,9% 14,5% 12,9% 12,7% 8,6% 6,0% 3,5% 3,5% 2,0% (Source: ACNIELSEN)
SUPERMARCHES 400-2500 mq COOP 0,3% CONAD 0,2% A&O SELEX 0,5% GS-CARREFOUR 0,1% INTERDIS - SIDIS ESSELUNGA -0,1% SISA -0,2% SMA - AUCHAN PAM D vs 2004 QUOTA DI MERCATO ANNO 2005 PER FORMATO 14,7% 12,4% 9,7% 9,2% 8,3% 6,1% 5,7% 5,5% 2,4% (Source: ACNIELSEN)
PROXI 100-400 mq CONAD 0,6% DIPERDI - CARREFOUR 1,0% SMA - AUCHAN 0,5% CRAI -0,7% A&O SELEX COOP SISA -0,1% SIGMA -0,1% SIDIS - DI MEGLIO D vs 2004 QUOTA DI MERCATO ANNO 2005 PER FORMATO 13,4% 10,4% 9,9% 7,6% 7,4% 6,3% 5,9% 5,6% 4,8% (Source: ACNIELSEN)
D vs 2004 QUOTA DI MERCATO ANNO 2005 PER FORMATO 35,9% 13,6% 8,0% 11,3% 6,1% 4,7% 4,3% 3,3% 2,2% 2,1% (Source: ACNIELSEN)
CARREFOUR ITALIA – SITUAZIONE ATTUALE Opportunità Rischi • Carrefour è multiformato ed è un Franchiseur • Grande potenziale di sviluppo Ipermercati, Soft discount e Franchise • Opportunità di incremento di quota di mercato sul territorio • I cambi d’insegna tra formati accelerano il nostro sviluppo • Carrefour è il numero 2 ma i concorrenti sono vicini • Accelerazione delle aperture delle insegne locali e Hard Discount • Legislazione locale costrittiva • Dominio dei costi in un contesto avverso
76 Hypers 559 Supers 1156 Proxi 22 Cash 55 Hypers 440 Supers 1031 Proxi 18 Cash L’AMBIZIONE 2008 9,2 Vendite lorde Mld € 346 AC Ml € 1.813 PDV 11,5% PDM 2006 7,5 Vendite lorde Mld € 258 AC Ml € 1.560 PDV 10,8% PDM Vendite lorde Mld € 6,8 51 Hypers AC Ml € 256 444 Supers 2005 PDV 1.487 975 Proxi 17 Cash PDM 10,4%