Download
1 / 34
350 likes | 475 Views
Mobility Control in Surfactant Floods: Improving NAPL recovery by in-situ control of viscosity. Dick Jackson INTERA Inc., Austin, Texas EPA NAPL Seminar, Chicago December 11, 2002. Mobility Control.

E N D
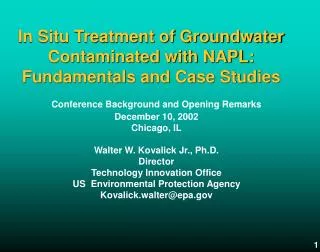
Mobility Control in Surfactant Floods: Improving NAPL recovery by in-situ control of viscosity Dick Jackson INTERA Inc., Austin, Texas EPA NAPL Seminar, Chicago December 11, 2002
Mobility Control • The term refers to controlling the viscosity, and subsequently, the direction of flow of injected fluids in heterogeneous oil reservoirs
Mobility Control • Mobility ratio: mobility of NAPL ÷ mobility of injectate • Where mobility = µj÷ keff, j • If µINJ>µNAPL , there is better sweep in-situ and higher NAPL recovery
Choice of Approaches • There are two ways of changing in-situ viscosities and thereby overcoming the effects of heterogeneities • Surfactant-Foam flooding • Surfactant-Polymer flooding
1: Foam Flooding • Surfactant solutions foam when air is injected into them • In-situ this forms a high viscosity and therefore stationary environment in the high perm zones, • Foam is temporary & reversible
1: Foam Flooding • Sequential injection of slugs of first surfactant solution then air cause temporary blocking of high-perm units, i.e., low mobility, thus • Foam causes redirection of surfactant into low-perm zones
Applications of Foam Flooding • Pilot Scale Test at Hill AFB in 1997 by INTERA and Rice University • Two large-scale Foam floods at Hill in 2001 and 2002 to remove TCE DNAPL Advisor: George Hirasaki, Rice University
1997 AATDF Surfactant-Foam Flood Demonstration, OU2, Hill AFB Cross Section Showing Growth of Foam Front, see Meinardus et al., 2002, JCH 54:173-193
Foam is produced from upper ports, DNAPL from the base C B A
Full-Scale SEAR at Hill AFB OU2, Utah DNAPL (70% TCE) South North Wasatch Range Injection Wells (3) Extraction Wells Extraction Wells Surfactant/Alcohol Staging Electrolyte (Brine) Staging Surfactant/Alcohol Staging Mixing/Injection On-line GC SCADA, Flow Control, Autosampling • 65,000 gal Swept Pore Volume • 110 ft Divergent Line Drive • Total Remediation Time = 35 days
2: Polymer Flooding • Hundreds of polymer floods conducted since 1960s by the oil industry • The purpose is to maintain local hydraulic gradients and thus cause the injected polymer solution to enter low perm units
2: Polymer Flooding • Polymer solutions have high viscosity, e.g., 5 – 20 cP, relative to the NAPL they are to displace • Polymer flooding will displace only free-phase NAPL not residual • Surfactant-polymer flooding displaces both free- and residual-phases • Advisor: Gary Pope, UT-Austin
Mobility Control with Polymers:-allows surfactants or biostimulants to be pushed into low-k zones
Polymer induced crossflow Permeability field for UTCHEM simulations 2 Darcy 10 Darcy 1 Darcy Progress of fluids without polymer Progress of fluids with polymer
Removal of Coal Tar by Surfactant-Polymer Flooding, Illinois
Coal Tar at Manufactured Gas Plants Coal tar may form both LNAPL [“floaters”] and DNAPL [“sinkers”] the NAPL will probably wet the soil most NAPL will be residual phase remediation by waterflooding is limited by viscous fingering [µw<µNAPL]
Characteristics of the Bloomington Site • Coal tar viscosity : 65 cP • Mostly a DNAPL but some naphthalene-rich LNAPL is also present • The (aqueous) benzene concentrations are the risk driver • depth to water: 10 feet • ~20-ft thick aquifer • fining upward alluvium with basal coarse sand • average hydraulic conductivity ~5x10⁻³ cm/s
Flow direction Column Study Results: The Effect of Polymers Surfactant flood Polymer/ surfactant flood 50-60% coal tar recovery 85-90% coal tar recovery
Surfactant System • 4% Alfoterra 123-8 PO-Sulfate • 8% Secondary Butyl Alcohol • 0.13% Xanthan gum biopolymer • 0.08% Calcium Chloride
Design simulations for different well configurations using UTCHEM
Piezometric Surface during Floodnatural grad = 0.001imposed grad = 1.7 (60º)
Wellfield injector extractors hydraulic control Pore volume = 7,000 L
Samples from EX-1 Flood begins 04/11 1000 Post-Flood begins 04/14 0300 4/13 0800 4/11 0800 4/11 1200 4/12 0800 4/12 1500 4/12 1800 4/13 1800 4/14 1115 4/14 1700 4/15 0800
10,000 1,000 solubility enhanced by heating 100 Solubilized Coal Tar Constituents [mg/L] ambient coal tar solubility 10 surfactant flood post-flood 1 0 12 24 36 48 60 72 84 96 Elapsed Time [hours] Coal Tar Solubilization at Well EX-1
Samples from EX-2 Flood begins 04/11 1000 Post-Flood begins 04/14 0300 4/12 1800 4/11 0800 4/12 0000 4/12 0800 4/12 1200 4/12 1500 4/12 2028 4/13 1200 4/14 0300 4/14 1700 4/15 0800
10,000 1,000 100 solubility enhanced by heating Solubilized Coal Tar Constituents [mg/L] ambient coal tar solubility 10 post-flood surfactant flood 1 0 12 24 36 48 60 72 84 96 Elapsed Time [hours] Coal Tar Solubilization at Well EX-2
Coal-Tar Recovery • 2,621 L free-phase by mobilization • 305 L of residual by solubilization • Total recovery=2,926 L • i.e., 42% of the 7,000 L test pore volume
Performance Assessment • Conducted by on-site contractors • [Burns & McDonnell, Oak Brook IL] • Before and after soil sampling indicated removal of • 92% of benzene and • 86% of PAHs
SEAR is Cost Competitive • Estimate for SEAR at Bloomington: ~$95 / yd3 of aquifer volume • Typical excavation/disposal costs: ~$100 - $150 / yd3 (both estimates are based on excavated yardage)
Summary • Heterogeneities in alluvium and fractured rock can be overcome by controlling the injectate viscosity • Surfactant-foam flooding • Polymer flooding • Surfactant-polymer flooding
Path Forward • Coupling Pressure Pulse Testing with surfactant-polymer flooding for creosote removal at Cape Fear NC • Use of polymer to push biostimulants or oxidants into low-perm units following surfactant flooding