Download
1 / 11
110 likes | 194 Views
Scientific Inquiry SCI 105.020. Statistical Models and Probability. Recap: Ex 2.7. Analyze the findings reported in the May 8, 1987 issue of Science Identify the four components involved in Model Evaluation process

E N D
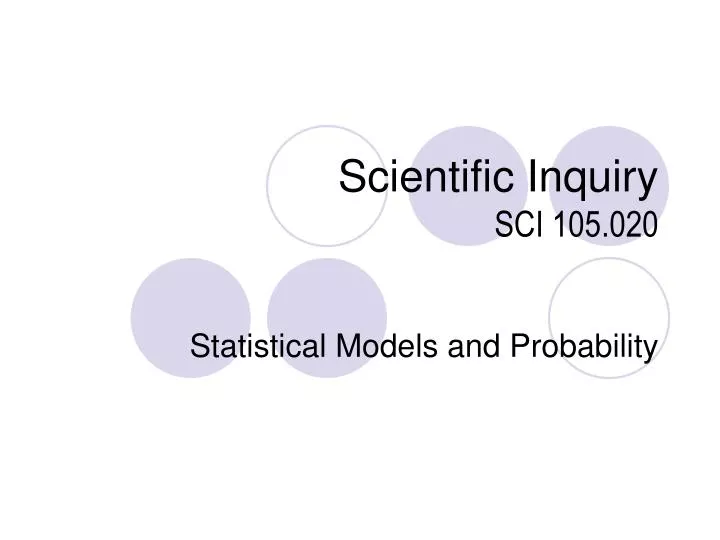
Scientific Inquiry SCI 105.020 Statistical Models and Probability
Recap: Ex 2.7 • Analyze the findings reported in the May 8, 1987 issue of Science • Identify the four components involved in Model Evaluation process • Run the six-step program described in the text to summarize what you see from the report
The Four Components Real World: Dinosaurs extinct 65m-yr ago: What caused it? Fit Model: Single catastrophic Event—extraterrestrial body hitting—caused it Observation Reasoning Calculation Prediction: Cracks in quartz + Debris blocking sunlight for months or years Climate cooled down Death of habitants on earth Agree Data: Unique crack patterns in quartz particles + Unusually high concentration of iridium found all over the world Size and speed: fit or not?
The Evaluation Process • RW: extinction of dinosaurs: What caused it? • Model: two alternative theories • Single catastrophic event hit by an extraterrestrial body • A series of volcanic eruptions • (New) Data: found all over the world • Unique crack patterns in quartz particles, and • Unusually high concentration of iridium • Prediction: • same as what the new data shown • Size and speed prediction: seemed reasonable • Data-prediction agreement: GOOD Model fit RW
Why Statistical/Probabilistic Models? • Widely used in science • Social/behavioral sciences • Public polls and surveys • Testing theories like: sunlight helps prevent depression • Bio-medical sciences • Can also be used in daily life • Professional sports: • AFC vs. NFC: which conference has stronger teams? • NBA: is the belief in “hot hand” supported by historical data?
Modeling with Statistical Hypothesis • Statistical hypothesis seem to be the only rational way to answer certain questions • What percentage of American women between the ages of 20 to 30 hold a full-time job? • Exceedingly difficult • Very costly • It’s impractical or even impossible to seek for characteristics in large populations • Instead, we can proximate them using small samples
Casual Models & Casual Hypothesis • Behavioral/bio-medical scientists concern about causes of characteristics exhibited by individuals • Does the dietary intake of cholesterol cause heart attacks in men? • Cause or Correlation? input output blackbox
The Elements of a Statistical Study • Terms associated with RW phenomenon • Population: the object of the investigation • A property is a characteristic that may exhibit in the population • Also known as a variable in the sense that it can be measured or classified to describe the property • Also known as a parameter as defined in the handout • Terms associated with model • Sample: selected members of the population • Statistics: a number computed from data that describes a characteristic of a sample
Stats as Predictions to Parameters • Theme: A statistic is computed from a sample to predict the parameter for the whole population. • Ex 1: average height of a Mercer Student Population size: 8000+ Population: Havg = XXX Sample: havg = xxx Sample size: 200
Descriptive Statistics • A graphical display of data • Histograms • Numerical summaries of data • Center • Spread • Shape • Outlier (See handout and sample worksheet for details) Super Bowl Scores (1967-2001)
Announcements • H/W Assignment 2 • Ex 7: p 8 in the handout • Create a histogram • Draw a boxplot and more as specified • Read the sections 5.3 through 5.7 (pp 124-137) in Giere’s text