Download
1 / 42
420 likes | 557 Views
Carrying Capacity, human appropriation and the Ecological Footprint. Readings. Vitousek 1986, Postel et al, 1996, rprogress.org optional – Daly et al 1992. Carrying Capacity. Upper limit to the ultimate size - carrying capacity (CC): Logistic or density dependent growth Growth determined by:

E N D
Carrying Capacity, human appropriation and the Ecological Footprint Readings. Vitousek 1986, Postel et al, 1996, rprogress.org optional – Daly et al 1992
Carrying Capacity • Upper limit to the ultimate size - carrying capacity (CC): • Logistic or density dependent growth Growth determined by: Pt = Pt-1 + r* Pt-1 * (CC - Pt-1)/CC Can we measure cc? Does it make sense to measure CC?
Carrying Capacity • Definition: The maximum population of a species an area can support without reducing its ability to support the same species in the future • Function both of the area and the organism (ex. Ceteris paribus Larger area higher cc)
Different CC for different species • Human carrying capacity • Complicated by individual differences in the amount and quality of resources consumed and the evolution in the types and quantity of the stuff we consume. • Issues? • Is it static?
Categories of CC • Biophysical carrying capacity • Maximum population size that could be sustained biophysically given certain technological capabilities • Social carrying capacity • maximum population that can be sustained under varying social systems. • Smaller than biophysical cc
Estimating CC • Total area times productivity/ccal needed to survive (e.g.) • Total area times productivity of that area – divided by total kcal required to survive. • How many calories people need to survive. • 5.9 billion people. • Useful? Realistic? Are we already appropriating too much?
A closer look 1Human appropriation of the products of photosynthesis • Vitousek et al. 1986 • Examined the impact on the biosphere by calculating the NPP (Net primary production) that humans have appropriated • Seminal study
Human appropriation of the products of photosynthesis • NPP: is the amount of energy left after subtracting the respiration of primary producers from the total amount of energy that is fixed biologically through photosynthesis • Total food resource on the earth
Human appropriation of the Products of Photosynthesis • Three calculations: • Low estimate: The NPP used directly for food, fuel, timber or fibers • Intermediate estimate: The productivity of land that is entirely devoted to human activities • High estimate: The above and productive capacity lost due to land conversion
Human appropriation of the Products of Photosynthesis • Low Calculation: • Consumption or production of grain • Consumption by life-stock • Forests • Aquatic ecosystems => 3% of all NPP
Human appropriation of the Products of Photosynthesis • Intermediate calculation • Includes what is co-opted by humans • Cropland • Pasture land • Forests use and conversion • Others such as lawns, golf courses and gardens =>19.9% of total NPP.
Human appropriation of the Products of Photosynthesis • High calculation • Includes losses in productivity • Replacement of natural ecosystems with agricultural systems • Forest conversion to pasture • Desertification • Areas occupied by humans =>40% of terrestrial NPP, 25% of global NPP
A closer look 2Human Appropriation of the products of freshwater • Objective: • Assess how much of the Earth’s renewable freshwater is realistically accessible to humans • Assess how much humans use directly
Human Appropriation of the Products of Freshwater • Terrestrial renewable freshwater = Precipitation = Evapotranspiration + Eventual runoff to the sea • Evapotranspiration (EP): Based on how much of NPP we use (use high estimate) => We appropriate 26% of all EP
Human Appropriation of the Products of Freshwater • Total runoff (40,700 km3/year): • Not accessible runoff excluded • Accessible (12,500 km3/year) • Withdrawals, consumption (we use 36% of all) • Instream uses (we use 18% of all) • Total appropriated 54%
Conclusion • Humans appropriate 30% of accessible RFWS • Humans appropriate 23% of all RFWS • Total runoff appropriated 54%
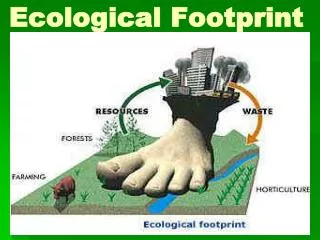
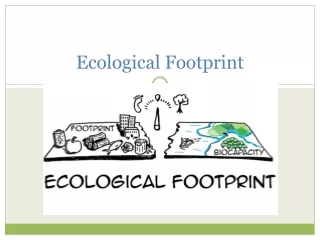
The ecological footprint • Is a measure of the load imposed by a given population on nature. • Represents the land area required to sustain a given level of resource consumption and waste discharge by that population • The land area required to provide the energy and material requirements by the economy (measured in ha)
Measuring • The land required to sustain a particular human population - that is the area of land of various classes that is required on a continued basis to: • Provide all the energy and material resources consumed • Absorb all the wastes that assimilate
Core footprint issues • Current industrial practices are sustainable • Include only basic natural services • Try not to double count • Simplify the ecological productivity values • Not really account for marine areas
The Calculation 4 Steps Step 1. • Consumption of various goods and services • Measured in Kg consumed/capita • C
The Calculation • Step 2. • Assess the productivity of each land category required (given in program) • Defined as how much land area is required to produce a particular amount • Use global averages • Measured in kg/ha • P
Calculation Step 3. • Assess the land mass appropriated per capita for the production of each consumption item. • Measured in hectare per capita => aa = C/P = (kg/capita)/(kg/ha) = ha/capita
Calculation • Step 4. • Sum over all aa – to get total EF • ∑aa, giving EF per capita per population Then of course you can multiply the total EF per capita by total population to get EF per nation.
Calculation • Sustainability factor • EF/total land area available • Should be smaller than 1
Calculation – a closer look Step 1. Consumption Items • Food • Housing • Transportation • Consumer goods • Services
A closer look – Step 2 • 8 Main land-use categories • Energy • Consumed land • Currently used land • Land of limited availability
Results in a global context • United States – 9.7 ha/capita • Canada – 8.4 ha/capita - NS - 8.1 ha/capita - AB - 7.9 ha/capita • France – 5.3 ha/capita • Japan – 4.8 ha/capita • Zimbabwe – 1.3 ha/capita • Bangladesh – 0.5 ha/capita Global Average: 2.3 hectares/capita
Some results • North American average 9,7 ha/person • Total land required 9,7*6 billion • Require 57 billion - only have 13 ha productive (need 4 earths) • Average footprint is 2,3 ha/person - need 13,8 billion ha
EF Applications • Region (country, province, town, university campus) • Personal Ecological Footprint (redefining progress, mountain equipment co-op) • Competing technologies (fuel cells) • Growing Techniques (field tomato vs. hydroponic tomato) • Policy decisions (rail vs. road, urban planning decisions) • Purchase decisions (cradle to grave) • Other (big mac, aquaculture, newspaper)
EF in Use • Teach concepts of sustainability, environmental issues, responsibility. • Benchmark of School Sustainability (define current state, assess progress -- footprint increase? Footprint decrease?) • Means of Comparison (between schools, between grades, students vs. teachers) • Promote holistic decision making
Fun with footprints • How much ecologically productive land is needed to sequester all the CO2 emissions released by the average Icelander’s fossil fuel consumption? Assume: Fossil fuel consumption 160GJ/cap/year Productivity of energy land 100 GJ/HA
Fun with footprints • How much area do you need to produce paper for the average Icelander? • 113 kg paper/cap/yr • Each metric ton requires 1,8 M^3 of wood • Wood productivity 2,3 M^3/ha/yr
Fun with footprints • The ecological footprint of various modes of transportation in Reykjavik • Ecological footprint of vegans vs others • Ecological footprint of the University
Advantages of the concept • Is clear and understandable • Are we living beyond our means? • Can be used in the Local Agenda 21 process • Can be used as a benchmarking tool • Can be used to public relations, information, motivation or for forming public opinion • Can be used comparatively • Nations, regions • Technologies, behaviors
Disavantages • Is static • Assumes no changes in productivity • Assumes equal productivity everywhere • Requires more sectors? • Requires more products?