Download
1 / 49
490 likes | 649 Views
Ozone And Fine Particle Attainment Issues In NC. Attainment Planning Technical Exchange Session 1 NCDENR, Division of Air Quality September 30 th , 2004. Ozone (O 3 ). What Is Ozone ?. Stratospheric and Ground-Level “Good Up High – Bad Nearby”

E N D
Ozone And Fine Particle Attainment Issues In NC Attainment Planning Technical Exchange Session 1 NCDENR, Division of Air Quality September 30th, 2004
What Is Ozone ? • Stratospheric and Ground-Level “Good Up High – Bad Nearby” • Ozone is not emitted directly into the atmosphere • Formed through complex photochemical reactions involving: • Sunlight • Precursor pollutants • VOC - Volatile Organic Compounds • NOx - Nitrogen Oxides • Critical meteorological conditions
Ozone – Public Health Risks • When inhaled, even at low levels, ozone can: • Cause inflammation of lung tissue • Cause acute or chronic respiratory problems • Aggravate, possibly trigger asthma • Decrease lung capacity • Repeated exposure in children may lead to reduced lung function as adults
Ozone Standard • 1-hour ozone standard • 0.12 ppm (124 ppb) • Over a 3-year span, the average number of exceedances per calendar year must be less than or equal to 1 • 8-hour ozone standard • 0.08 ppm (84 ppb) • 3-year average annual 4th highest daily maximum 8-hour average greater than 0.08 ppm is a violation of the standard
Ozone Design Value Calculation (8-hour) • Step 1: Sort all daily 8-hour average maximums in order from highest to lowest into a list for year #1 • Step 2: Repeat Step 1 for the next two consecutive years (#2 & #3) creating a total of three lists • Step 3: Average the 4th highest from each list or across the 3-year span • This average is truncated three significant figures or the thousandth decimal place
How Are Nonattainment Boundaries Set? • State sends initial recommendations for boundaries to USEPA • USEPA responds back with their recommendations • State follows up with additional data to support their recommendations if different from USEPA • USEPA designates - Does not have to follow state recommendations
State Process For Nonattainment Boundaries Recommendation • Evaluate which monitors are violating • Determine appropriate boundaries • Conduct public meetings • Coordinate with other agencies impacted by nonattainment designations (NCDOT and NCDOC, Local Government)
State Recommendation • State follows USEPA guidance (11 criteria) in the technical analysis • AQ data • Emissions • Population density / degree of urbanization / commercial development • Location of emission sources • Traffic / commuting patterns • Expected growth • Meteorology (transport patterns) • Geography / topography • Jurisdictional boundaries • Level of control of emission sources • Regional emission reductions
Example: Edgecombe And Nash Counties Situation: • Part of Rocky Mount MSA • Emissions are ~ one seventh of Triangle emissions • Majority of emissions from mobile sources… To be addressed as part of Federal and State strategy • Trajectory analysis strongly suggests ozone transport from Triangle NCDAQ Recommendation: Municipal boundary of Leggett where monitor is located
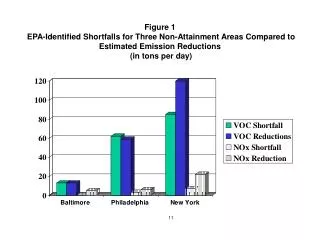
Criteria 1: Emissions & AQ • Percent NOx that county contributes to the area’s total NOx emission in 2000 Edgecombe = 38% Nash = 62 % HOWEVER…Edgecombe and Nash are the only counties in the Rocky Mount MSA; thus each county contributes a high percentage of emissions to the MSA as compared to counties in larger MSAs
Criteria 1: Emissions & AQ Compare to Triangle…
Criteria 5: Traffic &Commuting Patterns • VMT and commuting patterns were evaluated. The percent of workers commuting from the partial or recommended attainment county into the core urbanized counties in each area is presented Edgecombe to Wake = 0.1% Nash to Wake = 0.8%
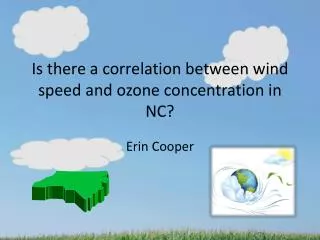
Criteria 7: Meteorology (Transport Patterns) • Leggett monitor is impacted by transported pollution from the Triangle under westerly flow • There is also a strong correlation between high ozone concentrations in Raleigh and high ozone concentrations at the Leggett • Leggett can also be impacted by emissions from Fayetteville and the I-95 corridor (southwest flow) • 36 hour back trajectories (starting at 20 GMT of each exceedance day) were run at heights of 10, 300, 1000 meters
Criteria 10: Control Of Emission Sources • Motor vehicle Inspections and Maintenance program (I/M) will be implemented in by January 2005 in Nash and Edgecombe
Designations • Based designations on MSA boundaries • USEPA designated less than an entire county the monitor(s) in the county was(were) attaining the standard • Mountain Area designated on GSMNP boundaries since: • Violating monitor is high elevation • Nighttime exceedances
Ozone Nonattainment Requirements – Timeline • Immediate (June 15, 2004) • New source review • General conformity • One year • Transportation conformity • Three years • State Implementation Plan (SIP) – attainment demonstration • Five years (or as expeditiously as practicable) • Attain standard (Triangle, RMT, GSMNP) • Six years (or as expeditiously as practicable) • Attain standard (Charlotte)
New Source Review • Becomes effective June 15, 2004 • Minimum thresholds for various pollutants and activities • Existing facilities don’t have to do anything unless they modify! • New or modified facilities • Adopt LAER(Lowest Achievable Emission Rate) • Emissions offsets
Transportation Conformity • Becomes effective June 15, 2005 • Transportation plan must “conform” to air quality plans • Analysis to ensure that transportation projects don’t make the air worse • Doesn’t necessarily have to reduce air pollution • Failure to conform means Federal highway funding is withheld
State Implementation Plan (SIP) • Must be submitted to EPA within three years • Details the State’s plan to bring the area into attainment of the Federal standard • Most significant features are already underway • Clean Smokestacks Act • Vehicle emissions testing • Low sulfur fuels • Cleaner Engines
PM2.5 (2.5 µm) PM10 (10µm) What Is PM2.5 ? Hair cross section (70 mm) Human Hair (70 µm diameter)
Primary & Secondary PM2.5 Primary Sources Secondary Formation • Combustion- Fire places, wood stoves, opening burning, vehicles, and industry • Chemical Transformation- Gases (e.g. SO2, Carbon, NH3, & NOx) condense and combine in the atmosphere
PM2.5 – Public Health Risks Are Significant Particles are linked to: • Premature death from heart and lung disease • Aggravation of heart and lung diseases • Hospital admissions • Doctor and ER visits • Medication use • School and work absences • And possibly to • Lung cancer deaths • Infant mortality • Developmental problems in children, such as low birth weight
PM2.5 Standard • Annual PM2.5 standard • 3-year average of the spatially averaged annual means is less than or equal to 15.0 μg/m 3 • Daily PM2.5 standard • 3-year average of the 98th percentile values at each monitoring site is less than or equal to 65 μg/m 3
PM2.5 Design Value Calculation (Annual) • Step 1: Average 24-hour measurements to obtain quarterly means at each monitor • Step 2: Average quarterly means to obtain annual means at each monitor • Step 3: Average across designated monitoring sites to obtain an annual spatial mean for an area • Step 4: Average 3 years of annual spatial means to obtain a 3-year average of spatially averaged annual means
PM2.5 Nonattainment Requirements – Timeline • November/December 2004 • Designations • January/February 2005 • Effective date of designations • New source review + General conformity • One year • Transportation conformity • Three years • State Implementation Plan (SIP) – attainment demonstration • Five years (or as expeditiously as practicable) • Nonattainment areas must attain
What Is NC Doing To Solve The Air Quality Problems? • Participation in the Southern Appalachian Mountain Initiative • Adoption of Clean Air Bill of 1999 • Adoption of NOx SIP Call Rule • Adoption of Clean Smokestacks Act • Section 126 Petition • Participation in Southeast’s Regional Haze Planning Organization (VISTAS)
North Carolina Clean Smoke Stacks Act • NOx & SO2 Caps on emissions • Tons / year • Caps per Company - They decide on controls • Phased compliance; 1 Jan ’07, ‘09, ‘13 • Actual reductions in NC • Unique cost recovery feature • Recommendations on Hg & CO2; Sep ‘05 • Reduction credits held by the State • SAMI: Greatest AQ benefit for a state comes from reductions in that state; but, controls in all states needed to fully solve AQ problems
Emissions Reductions Under Clean Smokestacks Bill 489,000 500,000 450,000 400,000 350,000 300,000 245,000 250,000 250,000 200,000 130,000 150,000 60,000 100,000 56,000 50,000 2007 2009 1998 1998 2013 2009 SO2 (tons/year) NOx (tons/year)
What Is EPA Doing To Solve The Air Quality Problems? • Cleaner car and light truck standards • Cleaner gasoline • Cleaner heavy duty engine standards • Cleaner diesel • Cleaner Nonroad Engines • Clean Air Interstate Rule
What Are Some Local Measures? • Focus on categories of major emissions • Reduction in vehicle miles traveled • Nonroad Engines – fleet turnover • How growth is handled • Episodic controls
For More Information: • Visit our web site: • http://ncair.org • Contact: Michael.Abraczinskas@ncmail.net 919-715-3743 George.Bridgers@ncmail.net 919-715-6287 Laura.Boothe@ncmail.net 919-733-1488