Download
1 / 22
220 likes | 226 Views
Lecture 18:. Correlations: testing relationships between two metric variables. Agenda. Reminder about Lab 3 Brief Update on Data for Final Correlations. Probability Revisited. To make a reasonable decision, we must know: Probability Distribution

E N D
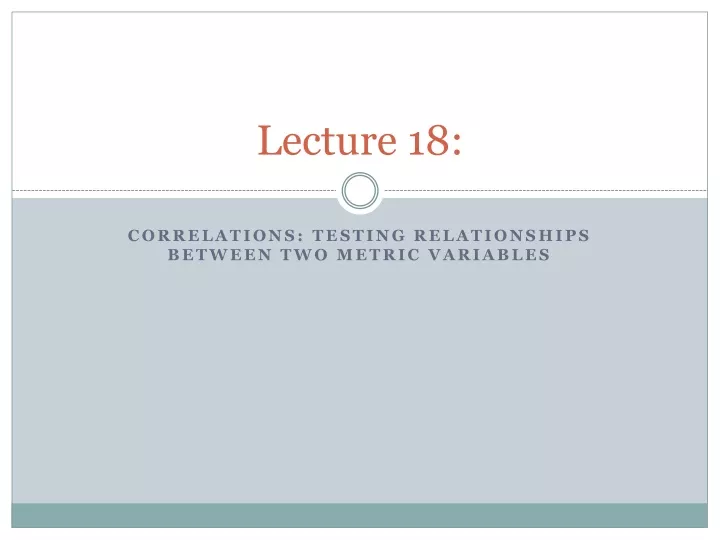
Lecture 18: Correlations: testing relationships between two metric variables
Agenda • Reminder about Lab 3 • Brief Update on Data for Final • Correlations
Probability Revisited • To make a reasonable decision, we must know: • Probability Distribution • What would the distribution be like if it were only due to chance? • Decision Rule • What criteria do we need in order to determine whether an observation is just due to chance or not.
Quick Recap of An Earlier Issue:Why N-1? • If we have a randomly distributed variable in a population, extreme cases (i.e., the tails) are less likely to be selected than common cases (i.e., within 1 SD of the mean). • One result of this: sample variance is lower than actual population variance. Dividing by n-1 corrects this bias when calculating sample statistics.
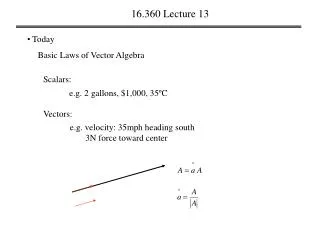
Checking for simple linear relationships • Pearson’s correlation coefficient • Measures the extent to which two metric or interval-type variables are linearly related • Statistic is Pearson r, or the linear or product-moment correlation • Or, the correlation coefficient is the average of the cross products of the corresponding z-scores.
Ranges from zero to 1, where 1 = perfect linear relationship between the two variables. Negative relations Positive relations Remember: correlation ONLY measures linear relationships, not all relationships! Correlations
Interpretation • Recall that Correlation is a precondition for causality– but by itself it is not sufficient to show causality (why?) • Correlation is a proportional measure; does not depend on specific measurements • Correlation interpretation: • Direction (+/-) • Magnitude of Effect (-1 to 1); shown as r • Statistical Significance (p<.05, p<.01, p<.001)
Correlation: Null and Alt Hypotheses • Null versus Alternative Hypothesis • H0 • H1, H2, etc • Test Statistics and Significance Level • Test statistic • Calculated from the data • Has a known probability distribution • Significance level • Usually reported as a p-value (probability that a result would occur if the null hypothesis were true). price mpg price 1.0000 mpg -0.4686 1.0000 0.0000
Factors which limit Correlation coefficient • Homogeneity of sample group • Non-linear relationships • Censored or limited scales • Unreliable measurement instrument • Outliers
Outliers Outlier