Download
1 / 15
150 likes | 168 Views
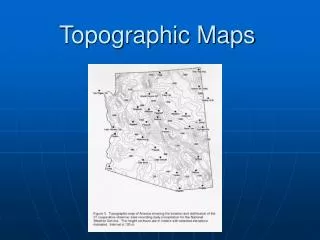
Topographic Maps. What is a topographic map?. Topographic maps show changes in elevation and physical features of the land along with man made features. uses a small scale to show close up details made by the USGS (U.S. Geological Survey). What are some of its uses?.

E N D
What is a topographic map? • Topographic maps show changes in elevation and physical features of the land along with man made features. • uses a small scale to show close up details • made by the USGS (U.S. Geological Survey)
What are some of its uses? • Tell good places to build houses, stores, or a new school • Use it before you take a hike or a cycling trip
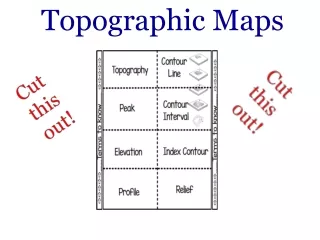
What is a contour line? • A line that connects equal areas of elevation.
Contour lines • A contour line represents points of equal elevation (all points on the line are the same distance from sea level). • Contour lines can not touch or cross (one point can not have two elevations)
Contour Interval The vertical distance between contour lines is called the contour interval.
Contour lines • Usually contour lines increase in elevation as you go from lower to higher elevations. • If you must decrease you use a special contour line that has hasher lines.
Contour Profiles There are times when you may want a profile (side view) of a contour map
Gradient • Gradient is the change in field value over the distance the change occurs • In maps it is the change in elevation over distance • Ex. If you go from 100ft to 200ft in 2miles ….. 100ft-200ft = 100ft …. 100ft/2mi = 50Ft/mi
Try some: Trip #1- You travel 4 miles and your elevation change goes from 350 ft to 1200 ft, your gradient would be: Trip#2- You travel 10 miles and your elevation change goes from sea level to 476 Ft, your gradient would be: Which trip would be easier(smaller gradient)?
Rules for Reading a Topographic Map…. Figure out the contour interval by subtracting the values of adjacent contour lines. A point on a line will have the elevation of that line. Close contour lines = steep gradient (slope) Spaced out contour lines = small gradient (slope)
Rules Cont. The elevation of a contour line next to the ocean shore line = 0 feet or 0 meters. A stream will flow down hill or the opposite way the contour lines shape of a “V” points.
Drawing Contour Maps Connect the same numbers on the map using only the numbers of the Contour Interval. Lines can only stop or start at the edge of the map. Lines can never touch. When drawing a depression, the first depression contour line must be the same elevation as the last regular contour line.