Download

1 / 22
220 likes | 303 Views
Model of Prediction Error in Chaotic and Web Driven Business Environment. Franjo Jović*, Alan Jović ** * Faculty of Electrical Engineering, University of Osijek, ** Faculty of Electrical Engineering and Computing, University of Zagreb. Summary.

E N D
Model of Prediction Error in Chaotic and Web Driven Business Environment Franjo Jović*, Alan Jović ** * Faculty of Electrical Engineering, University of Osijek, ** Faculty of Electrical Engineering and Computing, University of Zagreb
Summary • Prediction of time series data. Comparison between chaotic and web driven business transactions. Technology of artificial neural networks, genetic algorithms and Quacol algebra.Prediction of web driven trading process. Prediction error: sampling interval, correlation, time horizon. Modeling prediction error in Quacol algebra using triangle inequality.
Introduction • Prediction is usually treated through Bayes formula. Although probability of an outcome relies on past data it is bravely hypothesized that the continuation of the past can be predicted by modeling. Two schools of prediction philosophy are usually followed: using stochastic or functional patterns of previous data behavior.
Linear model • The most simple prediction model is a linear model. Here the future component of the signal is given with the expression • (1), • where: • - signal component determined in the i-th previous prediction interval • - unknown white noise component at the prediction instant • - coefficients of the time series expansion of previous time instants.
Chaotic processes • Models of chaotic processes are the most difficult for prediction. Takens has proposed the equation for sampling width, prediction horizon, and functional for a chaotic process, but without stating neither the horizon accuracy nor the functional nature
Quacol algebra • The positive ranking assignment is applied to set of variable data such as measurement data obtained in successive time intervals, i.e. measurement vector = (3.69, 7.15, 4.37, 15.73, 0.18) is transformed into its corresponding n-point graph = (4, 2, 3, 5, 1), to etc.
Goal function: correlation • Any desirable function that is investigated can be defined as goal function, = (10.06, 27.97, 15.28, 37.66, 0.12), and it is transformed into the corresponding goal n-point graph = (2, 4, 3, 5, 1). Their rank correlation equals to
Quacol algebra • . there is a rank difference between goal function and model variable that equals to .
Quacol algebra • Mixing values with a positively defined strictly increasing additive „background noise” and after ranking one obtains difference goal function . • where the operator searches the most appropriate variable according to its ranks to the corresponding or goal function ranks, R(.) is the rank operator
Quacol algebra • Two principles of the Quacol modeling algebra, such as given for example in equation (5), have to be defined: • First is the principle which states that any n-point graph should not have any equal ranks, e.g. is not allowed. • The second is the principle of continuity of the n-point graph for specific algebraic operations of multiplication and division.
Algebraic operations • Table 1. Multiplication and division operations in Quacol algebra
Quacol predictor • Goal model • Example
Prediction results • Predictor limits were tested under following constraints: • i) There was only one system variable and that one has to be predicted from past values. This is illustrated for the voltage signal of the ferroresonant circuit. • ii) The time horizon was tested for small variable set , the case of trading variable prediction • iii) The prediction precision was tested for short and long prediction interval for trading variables, .
Chaos prediction results • Prediction data for ranks of the ferroresonant circuit are given in Table 2. Mean prediction error of the linear model was around 277% and prediction error of the Quacol synthesized predictor was around 108%. The actual voltage levels were between -0,1969V and 0,3464V
Chaos prediction results • The worst case for linear predictor was predicting 2.5929V instead of 0.00825V and the worst case of the Quacol predictor was predicting the value between 0.024V and -0.0176V instead of 0.01892V.
Results - comments • Four trading variables were observed: closing, opening, high and low values. The intervals of scanning were one hour and the time duration was 24 hours. The 25-th value was predicted with different accuracy, for ten different trading situations (last three or four digits were given). Synthetic analytical variables were not used. • Prediction class A, correlation > 0,99 ; class B, correlation = 0,97- 0,99
Nature of the prediction error • Prediction error (trianular inequality): • Goal and goal difference functions G2n are linear independent variables, meaning that they are principally collected from mutually inverse variables and calculated in geometric way toward goal function fulfillment.
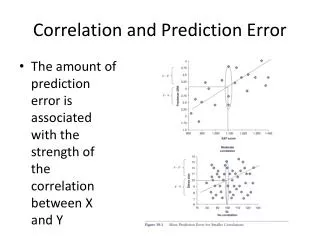
Discussion • Prediction accuracy and correlation of models are highly connected. This stems from ideal prediction case where the model behavior of the goal function has been completely discovered. Prediction error is then defined with the interval closest to the rank of the expected value.
Discussion Neither there are long enough data series that are without large chaotic behavior nor there is any linearity in the goal data distribution. Still predictions of smaller data series (>25 data series) can be expected with about 10% accuracy which can be favorable for many practical applications.