Download
1 / 10
100 likes | 204 Views
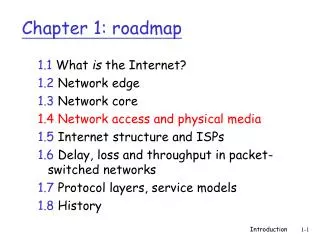
Chapter 1: roadmap. 1.1 What is the Internet? 1.2 Network edge end systems, access networks, links 1.3 Network core circuit switching, packet switching, network structure 1.4 Delay, loss and throughput in packet-switched networks 1.5 Protocol layers, service models

E N D
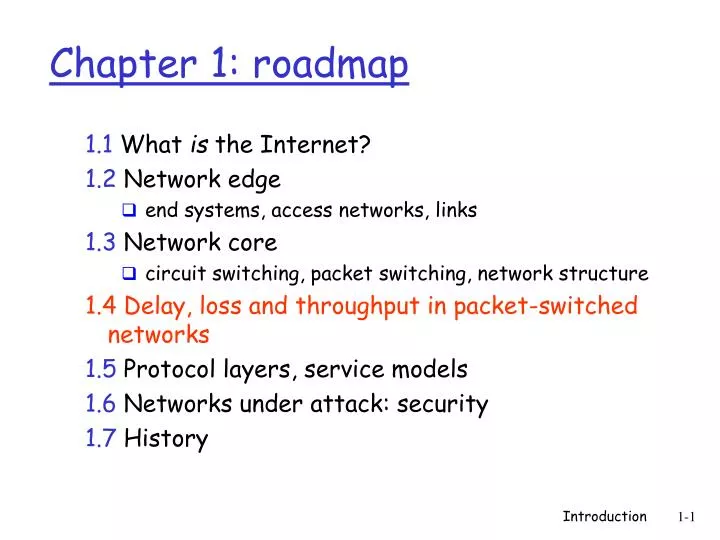
Chapter 1: roadmap 1.1 What is the Internet? 1.2 Network edge • end systems, access networks, links 1.3 Network core • circuit switching, packet switching, network structure 1.4 Delay, loss and throughput in packet-switched networks 1.5 Protocol layers, service models 1.6 Networks under attack: security 1.7 History Introduction
packets queue in router buffers packet arrival rate to link exceeds output link capacity packets queue, wait for turn packet being transmitted (delay) packets queueing (delay) free (available) buffers: arriving packets dropped (loss) if no free buffers How do loss and delay occur? A B Introduction
1. nodal processing: check bit errors determine output link transmission A propagation B nodal processing queueing Four sources of packet delay • 2. queueing • time waiting at output link for transmission • depends on congestion level of router Introduction
3. Transmission delay: R=link bandwidth (bps) L=packet length (bits) time to send bits into link = L/R 4. Propagation delay: d = length of physical link s = propagation speed in medium (~2x10⁸ m/sec) propagation delay = d/s transmission A propagation B nodal processing queueing Delay in packet-switched networks Note: s and R are very different quantities! Introduction
cars “propagate” at 100 km/hr toll booth takes 12 sec to service car (transmission time) car~bit; caravan ~ packet Q: How long until caravan is lined up before 2nd toll booth? Time to “push” entire caravan through toll booth onto highway = 12*10 = 120 sec Time for last car to propagate from 1st to 2nd toll both: 100km/(100km/hr)= 1 hr A: 62 minutes 100 km 100 km ten-car caravan toll booth toll booth Caravan analogy Introduction
Cars now “propagate” at 1000 km/hr Toll booth now takes 1 min to service a car Q:Will cars arrive to 2nd booth before all cars serviced at 1st booth? Yes! After 7 min, 1st car at 2nd booth and 3 cars still at 1st booth. 1st bit of packet can arrive at 2nd router before packet is fully transmitted at 1st router! See Ethernet applet at AWL Web site 100 km 100 km ten-car caravan toll booth toll booth Caravan analogy (more) Introduction
Nodal delay • dproc = processing delay • typically a few microsecs or less • dqueue = queuing delay • depends on congestion • dtrans = transmission delay • = L/R, significant for low-speed links • dprop = propagation delay • a few microsecs to hundreds of msecs Introduction
R=link bandwidth (bps) L=packet length (bits) a=average packet arrival rate Queueing delay (revisited) traffic intensity = La/R • La/R ~ 0: average queueing delay small • La/R -> 1: delays become large • La/R > 1: more “work” arriving than can be serviced, average delay infinite! Introduction
“Real” Internet delays and routes • What do “real” Internet delay & loss look like? • Traceroute program: provides delay measurement from source to router along end-end Internet path towards destination. For all i: • sends three packets that will reach router i on path towards destination • router i will return packets to sender • sender times interval between transmission and reply. 3 probes 3 probes 3 probes Introduction
“Real” Internet delays and routes traceroute: gaia.cs.umass.edu to www.eurecom.fr Three delay measurements from gaia.cs.umass.edu to cs-gw.cs.umass.edu 1 cs-gw (128.119.240.254) 1 ms 1 ms 2 ms 2 border1-rt-fa5-1-0.gw.umass.edu (128.119.3.145) 1 ms 1 ms 2 ms 3 cht-vbns.gw.umass.edu (128.119.3.130) 6 ms 5 ms 5 ms 4 jn1-at1-0-0-19.wor.vbns.net (204.147.132.129) 16 ms 11 ms 13 ms 5 jn1-so7-0-0-0.wae.vbns.net (204.147.136.136) 21 ms 18 ms 18 ms 6 abilene-vbns.abilene.ucaid.edu (198.32.11.9) 22 ms 18 ms 22 ms 7 nycm-wash.abilene.ucaid.edu (198.32.8.46) 22 ms 22 ms 22 ms 8 62.40.103.253 (62.40.103.253) 104 ms 109 ms 106 ms 9 de2-1.de1.de.geant.net (62.40.96.129) 109 ms 102 ms 104 ms 10 de.fr1.fr.geant.net (62.40.96.50) 113 ms 121 ms 114 ms 11 renater-gw.fr1.fr.geant.net (62.40.103.54) 112 ms 114 ms 112 ms 12 nio-n2.cssi.renater.fr (193.51.206.13) 111 ms 114 ms 116 ms 13 nice.cssi.renater.fr (195.220.98.102) 123 ms 125 ms 124 ms 14 r3t2-nice.cssi.renater.fr (195.220.98.110) 126 ms 126 ms 124 ms 15 eurecom-valbonne.r3t2.ft.net (193.48.50.54) 135 ms 128 ms 133 ms 16 194.214.211.25 (194.214.211.25) 126 ms 128 ms 126 ms 17 * * * 18 * * * 19 fantasia.eurecom.fr (193.55.113.142) 132 ms 128 ms 136ms trans-oceanic link * means no response (probe lost, router not replying) Introduction