Download
1 / 27
270 likes | 380 Views
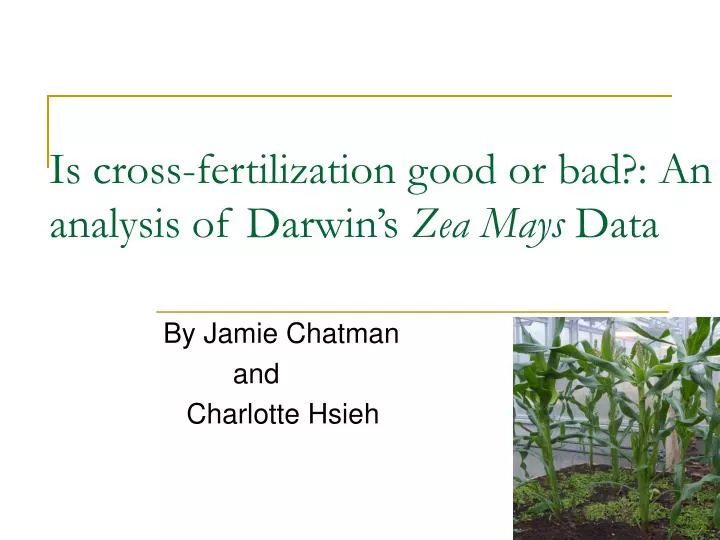
Is cross-fertilization good or bad?: An analysis of Darwin’s Zea Mays Data. By Jamie Chatman and Charlotte Hsieh. Outline. Short biography of Charles Darwin and Ronald Fisher Description of the Zea Mays data Analysis of the data

E N D
Is cross-fertilization good or bad?: An analysis of Darwin’s Zea Mays Data By Jamie Chatman and Charlotte Hsieh
Outline • Short biography of Charles Darwin and Ronald Fisher • Description of the Zea Mays data • Analysis of the data • Parametric tests (t-test, confidence intervals) • Nonparametric test (i.e. Wilcoxon signed rank) • Bootstrap tests • Conclusion
Short Biography of Charles Darwin • Darwin was born in 1809 in Shrewsbury, England • At 16 went to Edinburgh University to study medicine, but did not finish • He went to Cambridge University, where he received his degree studying to become a clergyman. • Darwin worked as an unpaid naturalist on a five-year scientific expedition to South America 1831. • Darwin’s research led to his book, On the Origin of Species by Means of Natural Selection, published in 1859. 1809-1882
Short Biography of Ronald Fisher • Fisher was born in East Finchley, London in 1890. • Fisher went to Cambridge University and received a degree in mathematics. • Fisher made many discoveries in statistics including maximum likelihood, analysis of variance, sufficiency, and was a pioneer for design of experiments. 1890-1962
Hypothesis • Null Hypothesis: • Ho: There is no difference in stalk height between the cross-fertilized and self-fertilized plants. • Alternative Hypothesis: • HA: Cross-fertilized stalk heights are not equal to self-fertilized heights • HA: Cross-fertilization leads to increased stalk height
Galton’s Approach to the Data Original Data Galton’s Approach
Parametric Test • Fisher made an assumption that the stalk heights were normally distributed • Crossed: X ~ • Self-fertilized Y~ • Difference: X-Y=d ~ • p-value : 0.0497 • Reject the null hypothesis that at the .05 level d.f.= 14
Parametric Test • 95% confidence interval Since zero is not in the interval, the null hypothesis that the differences =0, (or that the means) are equal is rejected
Fisher’s Non-Parametric Approach • If Ho is true, and the heights of the crossed and self-fertilized are equal, then there should be an equal chance that each one of the pairs came from the self-fert. or the crossed • If we look at all possible swaps in each pair there are 215 = 32,768 possibilities • The sum of the differences is 39.25 • But only 863 of these cases have sums of the difference as great as 39.25 • So the null hypothesis would be rejected at the level
Fisher’s Nonparametric Approach • The results of the nonparametric test agreed with the results of the t-test • Fisher was happy with this • However, Fisher believed that removing the assumption of normality in the nonparametric test would result in a less powerful test than the t-test • “[Nonparametric tests] assume less knowledge, or more ignorance, of the experimental material than does the standard test…” • We disagree
Non-Parametric Test • Wilcoxon Signed Rank Test 8.375 - 9.375 -
Non-Parametric Test • Wilcoxon Signed Rank Test • When n is large W~N(0, Var(W)) • This gives a p-value of 0.0409. Thus we reject the null hypothesis.
Bootstrap Methods The data “pull themselves up by their own bootstraps” by generating new data sets through which their reliability can be determined. • Introduced by Bradley Efron (1979) • 44 years after Fisher’s analysis • "If statistics had evolved at a time when computers existed, it wouldn't be what it is today (Efron)." • Uses repeated re-samples of the data • Allows the use of computer sampling approaches that are asymptotically equivalent to tests where exact significance levels require complicated manipulations • A sampling simulation approximation to Fisher’s nonparametric approach
Bootstrap: Random Sign Change • If Ho is true, there is an equal chance that the plants in each pair are cross-fertilized or self-fertilized • Method: • 1. Randomly shift from cross to self-fertilized in each pair • 2. Compute sum of differences • 3. Repeat 5,000 times • 4. Plot histogram of summed differences • 5. Find the number of summed differences > 39.25
Bootstrap: Random Sign Change Results • 124/5000 are >39.25. • The p-value is 2*(124/5000)=0.0496. • Compare to exact combinatorial p-value of 0.0526
Bootstrap: Resample Within Pots • Experimenters will tend to present data in such a way as to get significant results • In order to be sure that pairings in each pot are random, we can resample within pots • We assume equality of heights in each pot • Method: • 1. Sample 3 crossed plants in pot 1 with replacement • 2. Sample 3 self-fert. plants in pot 1 with replacement • 3. Repeat for pots 2-4 • 4. Compute sum of differences • 5. Repeat 5,000 times • 6. Plot histogram of summed differences • 5. Find the number of summed differences <0
Bootstrap: Resample Within Pots Results • 27/5000 are <0 • The p-value is 2*(27/5000)=0.0108
Resampling-Based Sign Test • Disregard size of difference and look only at the sign of the difference • If Ho is true, the probability of any difference being positive or negative is 0.5, and we can use a binomial approach, where we would expect half out of 15 pairs to have a positive difference and half to have a negative difference • We can count the number of positive differences in resampled pairs of size 15 • Method: • 1. Sample 3 crossed plants in pot 1 with replacement • 2. Sample 3 self-fert. plants in pot 1 with replacement • 3. Repeat for pots 2-4 • 4. Count the number of positive differences • 5. Repeat 5,000 times
Resampling-Based Sign Test Results • Almost every time out of 5,000, we get over 8 positive differences out of 15. • #pos diff < 6: 0/5000 • #pos diff < 8: 2/5000 • p-value is essentially 0
Randomization Within Pots • Disregard information about cross or self-fertilized • Find the distribution of summed differences by resampling from pooled data • Method: • 1. Pool plants in pot 1 • 2. Sample 3 plants from the pool w/replacement, treat as crossed • 3. Sample 3 plants from the pool w/replacement, treat as self-fert. • 4. Repeat for pots 2-4 • 5. Compute sum of differences • 6. Repeat 5,000 times • 7. Plot histogram of summed differences (=distribution of null hypothesis) • 8. Find the number of summed differences >39.25
Randomization Within Pots Results • 38/5000 are >39.25 • The p-value is 2*(38/5000)= 0.0152
Resampling Approach to Confidence Intervals • Using Darwin’s original differences: • 1. Sample 15 differences with replacement • 2. Compute the sum of differences • 3. Repeat 5,000 times • 4. Plot histogram of summed differences • 5. Take 125th and 4875th summed difference • Divide by sample size = 15 • We get 95% CI: (0.1749, 4.817), which is shorter than the t-interval (.0036, 5.230)
Resampling Approach to Confidence Intervals • In the resampling approaches, “95% of the resampled average differences were between 0.1749 and 4.817.” • This is not equivalent to the t- procedure, where “with probability 95%, the true value of the difference estimate lies between 0.0036 and 5.230.”
Conclusion • We can conclude from our tests that cross-fertilization leads to increased stalk heights • Despite Fisher’s concerns that removing normality assumptions was less intelligible than the t-test, nonparametric resampling-based methods are powerful and efficient
Is there anything else to consider? • Not using randomization, which might lead to environmental advantages and disadvantages • Soil conditions or fertility • Lighting • Air currents • Irrigation/evaporation
References • Fisher, R.A.(1935). The Design of Experiments. Edinburgh: Oliver & Boyd, 29-49. • Thompson, J.R.(2000). Simulation: A Modeler’s Approach. New York: Wiley-International Publication, 199-210. • http://www.fact-index.com/r/ro/ronald_fisher.html • http://www.lib.virginia.edu/science/parshall/darwin.html • http://www.mste.uiuc.edu/stat/bootarticle.html • http://www.psych.usyd.edu.au/difference5/scholars/galton.html