Download
1 / 38
380 likes | 523 Views
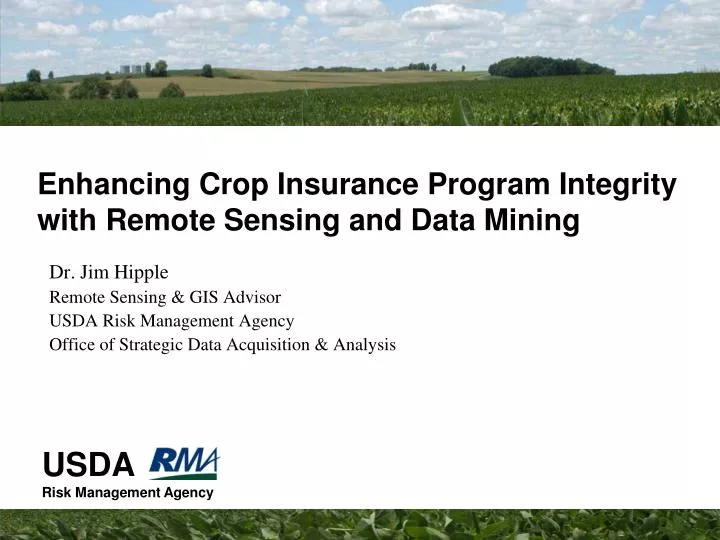
Enhancing Crop Insurance Program Integrity with Remote Sensing and Data Mining. Dr. Jim Hipple Remote Sensing & GIS Advisor USDA Risk Management Agency Office of Strategic Data Acquisition & Analysis.

E N D
Enhancing Crop Insurance Program Integrity with Remote Sensing and Data Mining Dr. Jim Hipple Remote Sensing & GIS Advisor USDA Risk Management Agency Office of Strategic Data Acquisition & Analysis
role is to help producers manage their business risks through effective, market-based risk management solutions promote, support, and regulate sound risk management solutions to preserve and strengthen the economic stability of America’s agricultural producers operates and manages the Federal Crop Insurance Corporation (FCIC) provides crop insurance to American producers through 16 private-sector insurance companies sell and service the policies. RMA develops and/or approves the premium rate, administers premium and expense subsidy, approves and supports products, and reinsures the 16 companies sponsors educational and outreach programs and seminars on the general topic of risk management About the Risk Management Agency FY 2007 Program Size Number of Policies ……….. 1.13 million Premium Volume ………… $6.55 billion Crop Value Insured …….. $67.2 billion* Acres Insured …………...… 271 million Data accurate as of September 25, 2007 FY 2005 Program Size Number of Policies ……….. 1.19 million Premium Volume ………… $3.95 billion Crop Value Insured …….. $44.29 billion* Acres Insured …………...… 246 million Data accurate as of January 16, 2006
RMA’s Goal • Expand the use of geographical information, satellite imaging, and other technology as a means of effectively monitoring weather and other conditions that influence crop insurance payments.
Integrating Remote Sensing, Geographic Information Systems (GIS), and Global Positioning Systems (GPS) Tracking Reported Crops & Monitoring for Discrepancies Determining Disaster Extentand Monitoring for Fraud Forensic Reconstruction and Analysis of Crop Histories
Expansion of AWiFS Collection to meet RMAs Program Integrity Goals
RMA Processing Goals • RMA/SDAA has an extensive KDD operation used to analyze patterns in crop insurance policies for increasing program integrity • the purpose is to develop automated / semi-automated procedures to incorporate moderate resolution satellite imagery into the KDD process • the goal is to be able to provide field-level metrics throughout the growing season on crop health
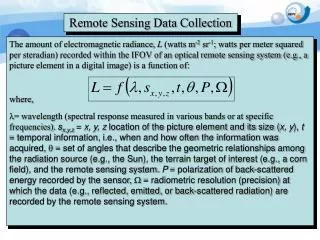
Process • develop automated / semi-automated procedures to preprocess IRS AWiFS (and other satellite data) • preprocessed to Top-of-Atmosphere-Reflectance (TOA) or % reflectance • no correction for atmospheric scattering or absorption, atmospheric gases (water vapor and ozone) and aerosols • TOA selected because it is a quick, low/no cost implementation with little other inputs needed & can work within our environment
Process, cont. • after AWiFS is preprocessed, extract data for each unique field • field information: USDA FSA Common Land Unit (CLU) • constrains: size (given each AWiFS pixel is approximately 0.70 acres), shape of field • data table by day of year for NDVI, NDWI, LSWI with mean & variance measure captured for each field • data in 8-bit format (2005-2007), 10-bit (2008+) • orthorectified data usually available to RMA from USDA Satellite Image Archive within 1 day (at most, 2 days) after acquisition
Preprocessing Implementation • developed in ESRI ArcCatalog ModelBuilder • straightforward processing • model could be used across USDA • distributed as a ToolBox • developed for AWiFS geotiff, but can be adapted for Landsat 7 ETM+ geotiff, Landsat 5 TM geotiff , IRS ResourceSat LISS-3 geotiff
Automation of Processing “RMA Automator Extension” Uses GDALInfo to extract parameters from the geotiff header and then batch the AWiFS for input into the Model
Naming Conventions • pull from CDINFO (or CDINFO.txt) (structure of data of the downloaded AWiFS) • process names the files in this manner: • yyyymmdd_ppprrrqxxxx.tif • yyyy = year • mm = month • dd = day • ppp = path • rrr = row • q = quad (A, B, C, D) • xxxx = index type (ndvi, ndwi, lswi) • example: 2007518_263040b.tif; 2007518_263040b(ndvi).tif; 2007518_263040(ndwi).tif
Indices Generated • vegetation index • NDVI (Normalized Difference Vegetative Index) • NDVI = (nir – red)/ (nir + red) • water index • NDWI (Normalized Difference Water Index) • NDWI = (red – green) / (red + green) • land surface water index (irrigated / non-irrigated differentiator) • LSWI (Land Surface Water Index) • LSWI = (nir – swir)/ (nir + swir)
Status • ModelBuilder complete for AWiFS & LISS • 50% of 2008 & 100% of 2005 US scenes AWiFS scenes processed by RMA • 100% of 2006 - 2007 US scenes AWiFS scenes processed • by West Virginia University National Geospatial Development Center / NRCS under CREDA) • NEGATIVE: single AWiFS scene takes 30-45 minutes to process • ArcGIS ModelBuilder – not that efficient! • Lack of support for multi-core, multi-processor under ESRI desktop products • POSTITIVE: ModelBuilder models do not have the strict security review requirements in USDA of other applications that might be written (can be quickly deployed)
Extraction of Field Level Metrics / Integration into Data Mining(development ongoing)
Integrate Derived Products into Data Mining • Normalized Difference Vegetation Index • NDVI = (nir – red)/ (nir + red) 4-band layer-stacked geotiff in % reflectance with pyramids built • Normalized Difference Water Index • NDWI = (red – green) / (red + green) • Land Surface Water Index (LSWI) • LSWI = (nir – swir)/ (nir + swir)
Data MiningStarting the integration of RS data Current work: • Use MODIS data to predict cotton yields in two highly homogeneous counties in west Texas • analyze remotely sensed data variance in vegetative health in two counties (one mainly irrigated, one mainly non-irrigated) under moderate environmental stress • analyze the ability of NDVI to predict county level yield across time, 2000 to 2006 • assess the ability of NDVI to predict yield on a day by day basis in 2006 at the farm sub-unit level From: B Little, M Schucking, B Gartrell, B Chen, K Ross, and R McKelllip (2008). “High Granularity Remote Sensing and Crop Production over Space and Time: NDVI over the Growing Season and Prediction of Cotton Yields at theFarm Field Level in Texas,” SSTDM 2008 (in press)
Multi-Crop Irregular Fields CLU and Field Selection CLU Problem Areas (due to spatial resolution of AWiFS)
Metric Extraction & Future Direction • working on the metric extraction procedure • select CLU that meet criteria of minimum size, shape • select CLU set that is within new image AWiFS footprint • calculate mean & variance values for indices & spectral bands for pixels within field boundary • develop ‘running’ smoothing procedure to fill in gaps • try to do this real-time or near real time • look at near real time classification of crop-type cover on a per field basis • validate 2006 & 2007 with NASS Cropland Data Layer
Questions … • Dr. Jim Hipple, USDA Risk Management Agency • james.hipple@rma.usda.gov