Download
1 / 48
480 likes | 554 Views
Protein structure prediction. Protein folds. Fold definition: two folds are similar if they have a similar arrangement of SSEs (architecture) and connectivity (topology). Sometimes a few SSEs may be missing.

E N D
Protein folds. • Fold definition: two folds are similar if they have a similar arrangement of SSEs (architecture) and connectivity (topology). Sometimes a few SSEs may be missing. • Fold classification:structuralsimilarity between folds is searched using structure-structure comparison algorithms.
Protein structure prediction flowchart Does sequence align with a protein of known structure? No Database similarity search Protein sequence Protein family analysis Yes Yes Relationship to known structure? Predicted three-dimensional structural model Three-dimensional comparative modeling Yes No Three-dimensional structural analysis in laboratory Is there a predicted structure? No Structural analysis From D.W.Mount
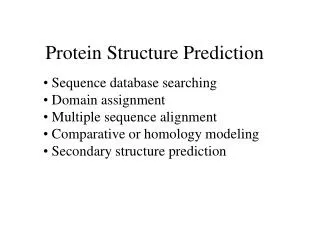
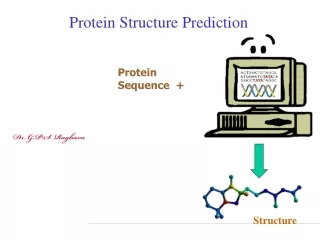
Protein structure prediction. Prediction of three-dimensional structure of a protein from its sequence. Different approaches: • Homology modeling (query protein has a very close homolog in the structure database). • Fold recognition (query protein can be mapped to template protein with the existing fold). • Ab initio prediction (query protein has a new fold).
Homology modeling. Aims to produce protein models with accuracy close to experimental and is used for: • Protein structure prediction • Drug design • Prediction of functionally important sites (active or binding sites)
Steps of homology modeling. • Template recognition & initial alignment. • Backbone generation. • Loop modeling. • Side-chain modeling. • Model optimization.
1. Template recognition. Recognition of similarity between the target and template. Target – protein with unknown structure. Template – protein with known structure. Main difficulty – deciding which template to pick, multiple choices/template structures. Template structure can be found by searching for structures in PDB using pairwise sequence alignment methods.
Two zones of protein structure prediction. Sequence identity 100 Homology modeling zone 50 Fold recognition zone 50 100 150 200 Alignment length
2. Backbone generation. If alignment between target and template is ready, copy the backbone coordinates of those template residues that are aligned. If two aligned residues are the same, copy their side chain coordinates as well.
3. Insertions and deletions. insertion AHYATPTTT AH---TPSS deletion Occur mostly between secondary structures, in the loop regions. Loop conformations – difficult to predict. Approaches to loop modeling: • Knowledge-based: search the PDB for loops with known structures • Energy-based: an energy function is used to evaluate the quality of a loop. Energy minimization or Monte Carlo.
4. Side chain modeling. Side chain conformations – rotamers. In similar proteins - side chains have similar conformations. If % identity is high - side chain conformations can be copied from template to target. If % identity is not very high - modeling of side chains using libraries of rotamers and different rotamers are scored with energy functions. Problem: side chain configurations depend on backbone conformation which is predicted, not real E2 E3 E = min(E1, E2, E3) E1
5. Model optimization. Energy optimization of entire structure. Since conformation of backbone depends on conformations of side chains and vice versa - iteration approach: Predict rotamers Shift in backbone
Classwork: Homology modeling. • Go to NCBI Entrez, search for gi461699 • Do Blast search against PDB • Repeat the same for gi60494508 • Compare the results
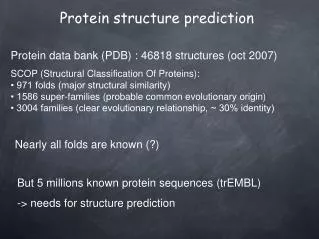
Fold recognition. Unsolved problem: direct prediction of protein structure from the physico-chemical principles. Solved problem: to recognize, which of known folds are similar to the fold of unknown protein. Fold recognition is based on observations/assumptions: • The overall number of different protein folds is limited (1000-3000 folds) • The native protein structure is in its ground state (minimum energy)
Fold recognition. Goal: to find protein with known structure which best matches a given sequence. Since similarity between target and the closest template is not high, pairwise sequence alignment methods fail. Solution: threading – sequence-structure alignment method.
Threading – method for structure prediction. Sequence-structure alignment, target sequence is compared to all structural templates from the database. Requires: • Alignment method (dynamic programming, Monte Carlo,…) • Scoring function, which yields relative score for each alternative alignment
Protein structure prediction: target sequence is compared to structures using sequence-structure alignment Structural templates Score1 Score2 Score3 Target sequence Concept of threading: D. Jones et al, 1993
Protein structure prediction: target sequence is compared to structures using sequence-structure alignment Structural templates Score3>Score2>Score1 Score1 Score2 Score3 Structural model of target Target sequence
Scoring function for threading. • Contact-based scoring function depends on amino acid types of two residues and distance between them. • Sequence-sequence alignment scoring function does not depend on the distance between two residues. • If distance between two non-adjacent residues in the template is less than 8 Å, these residues make a contact.
Scoring function for threading. Ala Trp Tyr Ile “w” is calculated from the frequency of amino acid contacts in PDB; ai – amino acid type of target sequence aligned with the position “i” of the template; N- number of contacts
Classwork: calculate the score for target sequence “ATPIIGGLPY” aligned to template structure which is defined by the contact matrix.
Evaluation of quality of structural model • Correct bond length and bond angles • Correct placement of functionally important sites • Prediction of global topology, not partial alignment (minimum number of gaps) >> 3.8 Angstroms
Success and limitations of structure prediction Limitations: • Models of large and remotely related proteins are not very accurate • Domain boundaries are difficult to define • Models often do not provide details for functional annotation Success: • Accuracy scores almost doubled from CASP1 to CASP6, might be because of database size • Models of small targets are very accurate Adapted from Kryshtafovych et al 2005
GenThreader http://bioinf.cs.ucl.ac.uk/psipred. • Predicts secondary structures for target sequence. • Makes sequence profiles (PSSMs) for each template sequence. • Uses threading scoring function to find the best matching profile.
Common properties of protein-protein interactions. rim • Majority of protein complexes have a buried surface area ~1600±400 Ǻ^2 (“standard size” patch). • Complexes of “standard size” do not involve large conformational changes while large complexes do. • Protein recognition site consists of a completely buried core and a partially accessible rim. • Trp and Tyr are abundant in the core, but Ser and Thr, Lys and Glu are particularly disfavored. core Top molecule Bottom molecule
Different types of protein-protein interactions. • Permanent and transient. • External are between different chains; internal are within the same chain. • Homo- and hetero-oligomers depending on the similarity between interacting subunits. • Interface type can be predicted from amino acid composition (Ofran and Rost 2003).
Verification of experimental protein-protein interactions. • Protein localization method. • Expression profile reliability method. • Paralogous verification method.
Protein localization method. Sprinzak, Sattath, Margalit, J Mol Biol, 2003 A – A3: Y2H B: physical methods C: genetics E: immunological True positives: • Proteins which are localized in the same cellular compartment • Proteins with a common cellular role
Expression profile reliability method. Deane, C. M. (2002) Mol. Cell. Proteomics 1: 349-356
Paralogous verification method. PVM method is based on observation that if two proteins interact, their paralogs would interact. Calculates the number of interactions between two families of paralogous proteins. Deane, C. M. (2002) Mol. Cell. Proteomics 1: 349-356
Experiment (E) Structure detail (S) Predicted Physical (P) Functional (F) Curated (C) Homology modeling (H) *IMEx consortium Interaction databases
Protein interaction databases • Protein-protein interaction databases • Domain-domain interaction databases
DIP database • Documents protein-protein interactions from experiment • Y2H, protein microarrays, TAP/MS, PDB • 55,733 interactions between 19,053 proteins from 110 organisms.
DIP database Duan et al., Mol Cell Proteomics, 2002 • Assess quality • Via proteins: PVM, EPR • Via domains: DPV • Search by BLAST or identifiers / text
BIND database Alfarano et al., Nucleic Acids Res, 2005 • Records experimental interaction data • 83,517 protein-protein interactions • 204,468 total interactions • Includes small molecules, NAs, complexes
Classwork. • Go to DIP webpage (http://dip.doe-mbi.ucla.edu) • Retrieve all interactions for cytochrome C, tubulin, RNA-polymerase from yeast • How many of them are confirmed by several experimental methods?
Protein interaction databases • Protein-protein interaction databases • Domain-domain interaction databases
InterDom database Ng et al., Nucleic Acids Res, 2003 • Predicts domain interactions (~30000) from PPIs • Data sources: • Domain fusions • PPI from DIP • Protein complexes • Literature • Scores interactions
Pibase database • Records domain interactions from PDB and PQS • Domains defined with SCOP and CATH • All inter-domain and inter-chain distances within 6 Ǻ are considered interacting domains • From interacting domain pairs, create list of interfaces with buried solvent accessible area > 300 Ǻ2
Classwork. • Go to Pibase website http://salilab.org/pibase • Select largest structural complexes, 1k73, 1i6h • Compare two complexes in terms of the number of interacting domains, #interactions per node
NCBI CBM database Shoemaker et al., Protein Sci, 2006. • To retrieve interactions: • Record interactions • Use VAST structural alignments to compare binding surfaces • Study recurring domain-domain interactions • CBM– database of interacting structural domains exhibiting Conserved Binding Modes
Definition of CBM • Interacting domain pair – if at least 5 residue-residue contacts between domains (contacts – distance of less than 8 Ǻ) • Structure-structure alignments between all proteins corresponding to a given pair of interacting domains • Clustering of interface similarity, those with >50% equivalently aligned positions are clustered together • Clusters with more than 2 entries define conserved binding mode.
Number of interacting pairs and binding modes • 833 conserved interaction types • 1,798 total domain interaction types • Up to 24 CBMs per interaction type • Classify complicated domain pairs by CBMs • Globin example: • 630 pairs • 2 CBMs account for majority
Classwork. • Retrieve structures 1GY3, 1E9H, 1OL2 • Examine all interactions within and between chains/domains. • How many CBMs do you find?