Download
1 / 66
710 likes | 958 Views
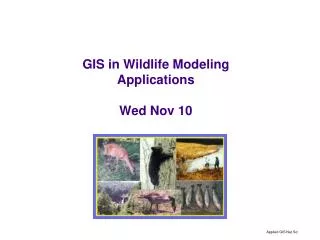
GIS in Wildlife Modeling Applications RESM 493q Wed Nov 11. Overview. GIS and wildlife modeling in general Inventory and monitoring Predictive modeling Wildlife management Aquatic wildlife modeling with GIS Terrestrial wildlife modeling with GIS. Wildlife management.

E N D
Overview GIS and wildlife modeling in general • Inventory and monitoring • Predictive modeling • Wildlife management Aquatic wildlife modeling with GIS Terrestrial wildlife modeling with GIS
Wildlife management Purposes of wildlife management: • Protect and enhance wildlife populations and their habitats • Promote opportunities for recreation, research, and education related to wildlife
GIS in wildlife management • GIS provides a tool for analyzing wildlife distributions and assess habitat • Assess the physical and environmental conditions to determine where an organism or group of organisms can live most comfortably • The factors in determining suitable habitat are inherently spatial, they may include climate, vegetation, land use, surface features, etc
1. Inventory and monitoring Uses of location records: Location records indicate where different wildlife species have been observed. These records can be used simply to determine species present (inventory) or to help determine key land cover and habitat elements used by various species (modeling). The nature conservancy inventory of plants in Canaan Valley
Recording observations with GPS Counties with Species X
Inventory and monitoring • Data from Wildlife Surveys and Inventories: Ways to collect and store the information • -X/Y point locations from GPS observations • Quads, quarter quads, hexagons, etc. • Does your sampling allow you to record just presence/absence or the # of individuals • Further calculations of species richness or diversity Canada Warbler Presence/absence All birds Species richness
Inventory and monitoring Uses of location records: Example: fish collection info (fishinfo.dbf and collections.dbf) Inventory and monitoring
Inventory and monitoring • Species richness = total number of different species (carp, bluegill, bass = 3) • Species diversity = total number of individuals across the species (1 carp, 10 bluegill, 1 bass = low diversity) • Calculations for diversity • Shannon diversity index • Simpsons Inventory and monitoring
Using join with fish collection data • Join the fishinfo.dbf to streams based on common dnrcode field Inventory and monitoring
Example: Observations along transects Monterey Bay, CA Monitoring Rockfish along transects Using Remotely Operated Vehicle (ROV) Transects
Example: Thermal imaging • Thermal imaging is a form of remote sensing • Infrared detection of heat sources • Helps in visual census of wildlife Video: Red Wolf in soybean field Alligator River NWR, NC Source: (Video) Field Trip Earth media gallery http://www.fieldtripearth.org
Thermal imaging (2) No deer N=5 deer • Advantages: • Fixed wing aircraft • Does not disturb animals (1000-1500 ft above ground) • Lower cost, covers more area than human observers • Geo-referenced images provide permanent record • Used for deer, moose, sage grouse, bighorn sheep, cranes, and others Source: Vision Air Research http://www.visionairresearch.com
Species movements • Remote monitoring of species movements • Mapping home ranges • Radio telemetry/transmitters • Transmitter on animal • Radio receiver/data logger • GPS tracking • Collars on animals • Monitor animal continuously
Example: Monitoring trends • North American Breeding Bird Surveys • Volunteers record birds seen along transects • Combine results by year, species North American Breeding Bird Survey Trend Map 1966-2003 Cerulean Warbler Source: USGS Patuxent Wildlife Research Center http://www.mbr-pwrc.usgs.gov/bbs/
Example: Tracking migratory birds Tundra swans Monitored with satellite transmitters Sir Syd – 2 ½ years. 16,000+ km Source: http://www.bsc-eoc.org/lpbo/swans/eachswan.html
Telemetry • Mapping and Tracking Animal Movements • Telemetry – mapping telemetry results • Temporal comparisons • Daily movements • Seasonal migrations • Year to year movements/changes Allegheny woodrat Fitted with collar Inventory and monitoring
Example: Tracking large mammals with GPS • Individual animals with collars • Collars transmit signals to satellite • Satellite transmits location of individuals back to headquarters • Complete record of animal movement • Locations plotted on maps, overlaid with other data, even included on live Internet mapping sites Colorado Division of Wildlife Grand Mesa Moose Tracking Project Students track moose over Internet = moose Source: Colorado Division of Wildlife http://wildlife.state.co.us/Education/StudentActivities/GrandMesaMooseTracking/
Example: Mapping home ranges • Animal telemetry locations used to map home range polygons • Many methods Minimum Convex Polygon: Contains all points (Simple method) White-tailed Deer Home Ranges using MCP method Westvaco Research Forest, Randolph Co., WV Source: Shawn Crimmins, WVU Wildlife Graduate Student, RESM 593 Student Project http://www.nrac.wvu.edu/RESM493/Fall05/students/Crimmins/index.htm
Example: Mapping home ranges Wood Thrush Pre/Post Fledging Home Ranges Westvaco Research Forest, WV • Animal Movement extension tools • Map daily movements • Map 95% minimum convex polygons Fitting bird with radio-tag harness Source: Tim Dellinger, RESM 593 Student Project Fall 2003
2. Predictive Modeling • Statistical modeling with GIS • Use GIS to characterize sites with known occurrence • Extrapolate to broader regions • Kentucky Warbler model • Key landscape variables: • Proportion of forested land cover • Brown-headed cowbird abundance • Mean wetness Source: USGS Upper Midwest Science Center – Dr. Wayne Thogmartin http://www.umesc.usgs.gov/terrestrial/migratory_birds/bird_conservation/bcr28_kentucky_warbler.html
Predictive modeling • Scales of modeling: • Landscape scale - (1,000 – 1,000,000 ha) • Site-specific scale or microhabitat – evaluating habitat characteristics at these scales is generally finer than data allows Assessing results of predictive modeling: • Chi-square analysis (compare results to random) • Other statistical methods Predictive modeling
Example: Aquatic habitat mapping Crean Lake, Canada Data collected for lake trout study Source: ESRI 2006 Map Book Saskatchewan Environment Hydro-acoustics program http://www.se.gov.sk.ca/
Predictive modeling tool - Spatial correlation analysis (SCA) • Primary objective is to reveal relationships between different types of spatial features • It determines whether the distribution of one type of feature, organized in a particular data layer is related to the distribution of features organized in another data layer • In SCA you are investigating whether a frequency is higher in certain areas (Does location matter?) • If two layers are correlated, then the information on these layers may be redundant • You can save money or time in not collecting redundant GIS information • If you have nominal data then use contingency table and chi squared goodness of fit tests • If you have interval or ratio scale data, then use correlation coefficient and regression models Predictive modeling
Example A • Is there a relationship between observed species locations and land cover type? Predictive modeling
Example A • We are testing the hypothesis: “There is NO significant relationship between observed species locations and land cover type” • Use tables in a stat book to get prob(chi squared <= .99) for 4 degrees of freedom If: computed statistic > 95% confidence interval for chi squared Then: reject hypothesis Our case: computed statistic 95% confidence interval 279.01 > 13.28 So, we reject the hypothesis and conclude that there IS a significant Relationship between observed species locations and land cover type Predictive modeling
Example B • Is there a relationship between the number of observed species locations and elevation? Predictive modeling
Example B • In this case since we have ratio data (elevation) with number of observations, we would use correlation coefficient and regression models • First perform overlay analysis to find the number of species at each elevation • Then plot the results * * * * * * # found * * * * * * * * * * * * * Elevation in meters Predictive modeling
Predictive modeling of wildlife notes Usefulness of Regional Modeling of Wildlife: • Saves expense of ground sampling over wide area, remote regions • May help focus ground efforts in certain areas of interest • Regional perspective useful in broad management of species across jurisdictions Interesting Problems Common to Predictive Modeling: • Inaccuracy in associating wildlife sighting locations with a single land cover type (if land cover mapped as grid cells) • Bias in wildlife sighting locations (animals easier to see in open land cover types)
3. Wildlife management with GIS • Fishing • Hunting • Human dimensions • Conservation • Invasive species
Example: GIS in fisheries Deep sea corals # of fishing trips Source: NMFS http://www.nmfs.noaa.gov/gis/how/habitat.htm
Example: Assessing hunting • Database of hunting results displayed on a map WVDNR Bear Harvest Data by County, 2003 Total bears: 1713 (State record) Source: West Virginia Division of Natural Resources http://www.wvdnr.gov/Hunting/BGB2003BearSResults.shtm
Example: Human dimensions and hunting • Stedman et al. 2004 - Using GPS to assess hunter movements • Daily patterns of movement • Hunters stay close to roads (within 1/3 mi) • Hunters avoid steep slopes • Assess impressions of hunters: • Actual distance traveled (measured with GPS) vs. perceived • Hunter density (lower than they think) Sproul State Forest, PA Penn State human dimensions study: Researcher attaches GPS unit to hunter’s arm Source: Stedman et al. 2004. Journal of Wildlife Management 68(4):762-773.
Example: Human-wildlife interaction Model: • Simple black bear habitat preferences • Buffered major road corridors WVU Research - Garrett County, MD Source: Ed Arrow, WVU Division of Forestry and Natural Resources graduate student
Management - Conservation • Introduction • Geospatial techniques • Applications • Conclusions • GIS can help prioritize or rank areas for conservation • Map different alternatives New Hampshire State Wildlife Action Plan Source: New Hampshire Fish and Game Department http://www.wildlife.state.nh.us/Wildlife/Wildlife_Plan/highest_ranking_habitat.htm
Management – Invasive species Source: Zebra Mussel Distribution in North America, USGS Dataset http://www.nationalatlas.gov/mld/zmusslx.html Zebra Mussel Distribution: Spread from 1998-present Introduced in Lake St. Clair, MI New sighting during the year Previous locations
= Fish passage installed at dam Presenting results • Maps - summarize information • Time series maps • Internet mapping tools
Presenting results • Google Earth • Internet mapping tool, no software required USDA Oral Rabies Vaccine Program 2006 Distribution Data in Google Earth Red = Ground application of vaccines Oral Rabies Vaccine Maps: http://www.aphis.usda.gov/ws/rabies/orv/index.html
Resources North American Breeding Bird Survey http://www.mp2-pwrc.usgs.gov/bbs Wildlife Ecology Related Software Links (not all GIS related) http://detritus.inhs.uiuc.edu/wes/ ESRI’s Conservation GIS program (grants and examples) http://www.conservationgis.org Strong 1991. Generation of Whitetailed Deer (Odocoileus Virginianus) Forage/Browse and Cover Estimates from Michigan Land Use/Land Cover Data. Proceedings of the 21st Annual ESRI International User Conference 2001, San Diego, CA. http://gis.esri.com/library/userconf/proc01/professional/papers/pap772/p772.htm Church, R. L., D. M. Stoms, and F. W. Davis, 1996. Reserve selection as a maximal covering location problem. Biological Conservation 76: 105-112 Tankersley, R., Jr. 1996. Black Bear Habitat in the Southeastern United States: A Biometric Model of Habitat Conditions in the Southern Appalachians. M.S. Thesis, University of Tennessee, Knoxville, TN. http://sunsite.utk.edu/samab/saa/saa_reports.html.
References Schamberger, M., Farmer, A. H., and Terrell, J. W. (1982). “Habitat suitability index models: Introduction,” Report No. FWS/OBS-82/10, U.S. Fish and Wildlife Service, Washington, DC. Steiner, F., Pieart, S., Cook, E., Rich, J., and Coltman, V. (1994). “State wetlands and riparian area protection programs,” Environmental Management 18(2), 183-201. U.S. Fish and Wildlife Service. (1980). “Habitat evaluation procedures (HEP),” ESM 102, Division of Ecological Services, Washington, DC. __________. (1981). “Standards for the development of Habitat Suitability Index models,” ESM 103, Division of Ecological Services, Washington, DC. Wyman, R. L. (1990). “What's happening to amphibians?” Conservation Biology 4, 350-52. O’Connell, T.J., L.E. Jackson, R. P. Brooks, 2000. Bird Guilds as Indicators of Ecological Condition in the Central Appalachians. Ecological Applications 10(6):1706-1721. U.S. Environmental Protection Agency. “MAIA Project Summary: Birds Indicate Ecological Condition of the Mid-Atlantic Highlands”, EPA/620/R-00/003, June 2000. “Currently being used in the EIS for Mountain Top Removal Mining in WV Coalfields”
Reference book NOTE: graphics used in this lecture are from chapters in this book
Why study this? Fishery biologists ask questions that are related to location • Fish abundance, growth, survival catch rates vary across locations • How do landscape conditions influence these factors • Human barriers, land use impacts, etc
How GIS can be useful to a fisheries biologist • Overlay coverages to find emerging patterns • Analyze buffers • What are the attributes at a particular location • Which areas or features meet a set of criteria • What spatial patterns exist in the data • Ask “what if” questions in modeling efforts
Applications in rivers and streams • Linear habitat features • Streams drain watersheds • Spatial interconnectedness of the aquatic and terrestrial systems • Mapping and modeling fish habitats and distributions • Mapping watershed land uses and their impacts on habitats and fish populations nested
Applications in reservoirs Example questions GIS can help answer • What bottom topography is associated with spawning habitat? • Which areas have a slope< 5% and gravel substrate? • Do fish use areas more during periods of higher inflows or water levels? • How much spawning habitat is lost if the water is drawn down 9 feet?