Download
1 / 48
480 likes | 512 Views
Explore Gaussian Mixture Models (GMM) and Expectation-Maximization (EM) algorithm in the RGB domain. Learn about pixel clusters, covariance matrices, EM basics, graph-cut optimization, and graph-cuts for image segmentation. Understand the energy function and α-expansion moves for energy minimization.

E N D
Gaussian Mixture Models andExpectation-Maximization Algorithm
The RGB Domain • A regular image
The RGB Domain • Image pixels in RGB space
Pixel Clusters • Suppose we cluster the points for 2 clusters
Pixel Clusters • The result in image space
2D Gaussians • d = 2 • x = random data point (2D vector) • = mean value (2D vector) • = covariance matrix (2D matrix) • The same equation holds for a 3D Gaussian
Exploring Covariance Matrix • is symmetric • has eigendecomposition (svd)
GMMs – Gaussian Mixture Models W H • Suppose we have 1000 data points in 2D space (w,h)
GMMs – Gaussian Mixture Models W H • Assume each data point is normally distributed • Obviously, there are 5 sets of underlying gaussians
The GMM assumption • There are K components (Gaussians) • Each k is specified with three parameters: weight, mean, covariance matrix • The total density function is:
The EM algorithm (Dempster, Laird and Rubin, 1977) Raw data Total Density Function GMMs (K = 6)
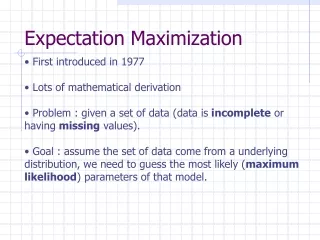
EM Basics • Objective: Given N data points, find maximum likelihood estimation of : • Algorithm: 1. Guess initial 2. Perform E step (expectation) • Based on , associate each data point with specific gaussian 3. Perform M step (maximization) • Based on data points clustering, maximize 4. Repeat 2-3 until convergence (~tens iterations)
EM Details • E-Step (estimate probability that point t associated to gaussian j): • M-Step (estimate new parameters):
EM Example data point t blue: wt,j Gaussian j
Back to Clustering • We want to label “close” pixels with the same label • Proposed metric: label pixels from the same gaussian with same label • Label according to max probability: • Number of labels = K
Motivation for Graph-Cuts • Let’s recall the car example
Motivation for Graph-Cuts • Suppose we have two clusters in color-space • Each pixel is colored by it’s associated gaussian index
Motivation for Graph-Cuts • A Problem: Noise • Why? Pixel labeling is done independently for each pixel, ignoring the spatial relationships between pixels!
Formalizing a New Labeling Problem • Previous model for labeling: • A new model for labeling. Minimize E: • f = Labeling function, assigns label fp for each pixel p • Edata = Data Term • Esmooth = Smooth Term • Lamda is a free parameter
The Energy Function • Labels Set: { j=1,…,K } • Edata: • Penalize disagreement between pixel and the GMM • Esmooth: • Penalize disagreement between two pixels, unless it’s a natural edge in the image • dist(p,q) = normalized color-distance between p,q
Minimizing the Energy • Solving Min(E) is NP-hard • It is possible to approximate the solution using iterative methods • Graph-Cuts based methods approximate the global solution (up to constant factor) in polynomial time • Read: “Fast Approximate Energy Minimization via Graph Cuts”, Y. Boykov, O. Veksler and R. Zabih, PAMI 2001
α-expansion moves • When using iterative methods, each iteration some of the pixels change their labeling • Given a label α, a move from partition P (labeling f) to a new partition P’ (labeling f’) is called an α-expansion move if: Current Labeling One Pixel Move α-β-swapMove α-expansionMove
Algorithm for Minimizing E(f) 1. Start with an arbitrary labeling 2. Set success = 0 3. For each label j 3.1 Find f’ = argmin(E(f’)) among f’ within one α-expansion of f 3.2 If E(f’) < E(f), set f = f’ and success = 1 4. If (success == 1) Goto 2 5. Return f How to find argmin(E(f’)) ?
A Reminder: min-cut / max-flow • Given two terminal nodes α and β in G=(V,E), a cut is a set of edges C E that separates α from β in G’=(V,E\C) • Also, no proper subset of C separates α from β in G’. • The cost of a cut is defined as the sum of all the edge weights in the cut. The minimum-cut of G is the cut C with the lowest cost. • The minimum-cut problem is solvable in practically linear time.
Finding the Optimal Expansion Move • Problem: Find f’ = argmin(E(f’)) among f’ within one α-expansion of f • Solution: Translate the problem to a min-cut problem on an appropriately defined graph.
Graph Structure for Optimal Expansion Move Terminal α • 1-1 correspondence between cut and labeling • E(f) is minimized! Cut C Terminal not(α)
A Closer Look • Each pixel gets a node P1 P2 Pα
A Closer Look • Add auxiliary nodes between pixel with different labels P1 P2 Pα
A Closer Look • Add two terminal nodes for α and not(α) P1 P2 Pα
A Closer Look P1 P2 Pα
A Closer Look P1 P2 Pα
A Closer Look P1 P2 Pα
A Closer Look P1 P2 Pα
A Closer Look P1 P2 Pα
Implementation Notes • Neighboring system can be 4-connected pixels,8-connected and even more. • Lamda allows to determine the ratio between the data term and the smooth term. • Solving Min(E) is simpler and possible in polynomial time if only two labels involved(see “Interactive Graph Cuts for Optimal Boundary & Region Segmentation of Objects in N-D Images”, Y. Boykov and M-P. Jolly 2001) • There is a ready-to-use package for solving max-flow(see http://www.cs.cornell.edu/People/vnk/software/maxflow-v2.2.src.tar.gz)
Final ProjectOptimized Color Transfer www.cs.tau.ac.il/~gamliela/color_transfer_project/color_transfer_project.htm