Download
1 / 21
210 likes | 285 Views
Science MCA-III Updates. Minnesota Department of Education Science Assessment Specialist Jim Wood Dawn Cameron jim.wood@state.mn.us dawn.cameron@state.mn.us 651.582.8541 651.582.8551. MCA Update. Scorable Item Samplers in 2012-13 Test D esign and Simulations Text to Speech

E N D
Science MCA-IIIUpdates Minnesota Department of Education Science Assessment Specialist Jim Wood Dawn Cameron jim.wood@state.mn.usdawn.cameron@state.mn.us 651.582.8541 651.582.8551
MCA Update education.state.mn.us Scorable Item Samplers in 2012-13 Test Design and Simulations Text to Speech Reporting: Data and Resources
Item Samplers – Teacher Guides education.state.mn.us
Item Samplers – Score reportshttp://www.mnstateassessments.org/itemsamplers.html Score Report Teacher Guide education.state.mn.us
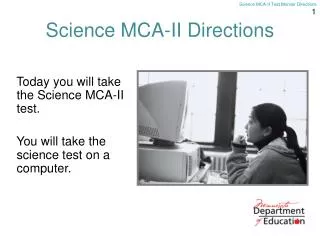
Test Design and Navigation education.state.mn.us
2013 MCA Assessment Results Summary education.state.mn.us Science Grades 5, 8 and high school MCA-III Statewide scores went up from 2012 Increase in performance was realized as standards were more consistently implemented across the state.
2013 State Proficiency Level education.state.mn.us
Comparison of 2012 and 2013St. Paul education.state.mn.us
Information found in MDE Data Center education.state.mn.us
Putting it all together education.state.mn.us • Interpreting Science MCA-III Test Scores • Overall scale scores (G01-99) • Scale scores match with the ALD’s • Strand, Sub-Strand levels • Reported using a different scale score system (1-9) • Standard Deviation • Standard Error of the Mean= SD/√n
Benchmark Analysis 6.1.3.1.1 education.state.mn.us
CAUTION!!!P-values and standard deviation education.state.mn.us All data is relative to the state data Watch the dotted lines – different colors may overlap in their standard deviation Keep an eye on the CLES metric when comparing schools
Food for Thought • Save time for evaluation of data, individually and as a team • What inferences can and cannot be made from results? • Formative vs. Summative strengths • What are you going to do with this data
Test Development Process Bias Review Test Specs Storyboard Writing Storyboard Review Item Review Bias Review Item Writing Field Test Items Data Review Operational Item Pool Achievement Levels Operational Test education.state.mn.us
Get involved! Assessment Advisory Panels—ongoing Register to be invited to panels at http://education.state.mn.us Educator Excellence Testing Resources Register for Advisory panels education.state.mn.us
HS Benchmark Graphs 2013 education.state.mn.us Broken down by Sub-strand
Interpretation of CLES education.state.mn.us Grade 5 Grade 8 0.45 – 16% 0.45 – 14% 0.50 – 50% 0.50 – 50% 0.55 – 90% 0.55 – 91% High School 0.45 – 15% 0.50 – 50% 0.55 – 95%