Download
1 / 47
470 likes | 630 Views
Rethinking Rural Policy & Practice: The Rural/Urban Dialectic, in a Disruptive Milieu. Presented to the Maryland Rural Action Assembly Baltimore, Maryland October 17, 2013 Charles W. Fluharty President & CEO Rural Policy Research Institute . Five Considerations.

E N D
Rethinking Rural Policy & Practice: The Rural/Urban Dialectic, in a Disruptive Milieu Presented tothe Maryland Rural Action Assembly Baltimore, Maryland October 17, 2013 Charles W. Fluharty President & CEO Rural Policy Research Institute
Five Considerations • Recalibrating the rural/urban dialogue and paradigm • Who wins: the World Bank or the OECD? • Rural imperatives, given this regional evidence • Challenging the hegemony of the urban metaphor, in a disruptive milieu • Concluding comments
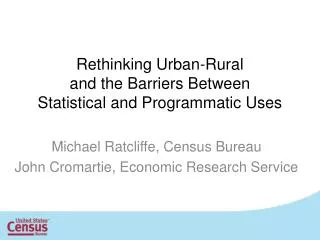
Rural and Urban Definitions • No definition is perfect at capturing rural and urban population dynamics • Official Census Bureau definition of urban includes places from 2,500 to several million • OMB Core Based Statistical Areas include some very rural counties in metro areas, because of commuting patters • No categorical definition can properly capture the continuum.
Urban and Rural Areas • The U.S. Census Bureau defines urban areas: • Core blocks and block groups with population density of 1,000 people per square mile. • Surrounding blocks with overall density of 500 ppmi2 • Range in size from 2,500 people to over 18 million people. • Ruralis everything that is not urban. • Based on the 2010 Decennial Census: • 59 million people live in rural areas (19%) • 249 million people live in urban areas (81%)
Is all urban the same, though? New York-Newark Population 18 million Bellevue, IA Population 2,543
Core Based Statistical Areas • Defined by the Office of Management and Budget. • Designed to be functional regions around urban centers. • Classification is based on counties. • Three classifications of counties: • Metropolitan • Nonmetropolitan countiesare divided into two types: • Micropolitan • Noncore
Usually, metropolitan is equated with urban and nonmetropolitan is equated with rural. So, if metropolitan is urban, then…
This is urban: Los Angeles-Long Beach-Santa Ana, CA Metro Area Population 12.8 million
And so is this: Armstrong County, Texas Population 1,901 Part of the Amarillo Texas Metropolitan Area
This is rural: Loving County, Texas Population 82
And so is this: Paducah, Kentucky Population 48,791
Most Counties are Urban and Rural! Coconino County, Arizona Population 134,421 Flagstaff Metro Area
Most metropolitan areas contain rural territory and rural people. In fact… Over half of all rural people live in metropolitan counties!
II. Who wins: the World Bank or the OECD?
The OECD New Rural Paradigm (2006) Guarantee an adequate attention to rural issues And empowerlocal communities and governments Rural is not synonymous with agriculture Rural is not synonymous with economic decline
The Critical Question: “What policy framework will best integrate rural and urban initiatives and programs, to advantage both ag and non-ag rural constituencies, their communities and regions, and enhance their children’s potential to thrive there in the 21st century?”
The Framework for Regional Rural Innovation New Narratives & Networks Quality of Place Critical Internal Considerations • Wealth Creation and Intergenerational Wealth Retention • Youth Engagement and Retention • Social Inclusion and Social Equity Collaborative Leadership Knowledge Networks & Workforce E-ship & Innovation
What is Demanded? • Asset-based development • Regional frameworks • Regional Innovation Policies Which Align Rural and Urban Interests • Support for New Intermediaries
Attention to Working Landscapes • Bridging Innovation and Entrepreneurship Support Systems, Across the Rural/Urban Chasm • Addressing Spatial Mismatch in Key Sectoral Alignments • Innovative and Linked Investment Approaches Which Enhance Jurisdictional and Cross-Sectoral Collaboration
IV. Challenging the hegemony of the urban metaphor, in a disruptive milieu
“All great truths begin as blasphemies.” --George Bernard Shaw
http://www.nytimes.com/2013/06/16/world/asia/chinas-great-uprooting-moving-250-million-into-cities.html?pagewanted=all&_r=0http://www.nytimes.com/2013/06/16/world/asia/chinas-great-uprooting-moving-250-million-into-cities.html?pagewanted=all&_r=0
Ratings of Institutions Wall Street Journal, June 5, 2013, http://ow.ly/lMrse
Charles W. Fluharty cfluharty@rupri.org President and CEO Rural Policy Research Institute 214 Middlebush Hall University of Missouri Columbia, MO 65211 (573) 882-0316 http://www.rupri.org/
…but not necessarily faster growth Only 45% of metro--regions grow faster than the national average. Metro-regions appear to have entered in a process of convergence. …signs of inefficiencies appear in significant number of metro-regions…
Contributions to aggregate growth depend on few hub regions… …the fat tail is equally important -- if not more -- to aggregate growth…
Lagging regions contribute to national growth Lagging Regions Contribution to Aggregate Growth Overall, they contributed to 44% of aggregate OECD growth in 1995-2007. In eight OECD countries lagging regions contributed more to national growth than leading regions. Bottom line: support for lagging regions need not be merely a “social” policy. They contribute a large share of national growth.