Download
1 / 20
200 likes | 269 Views
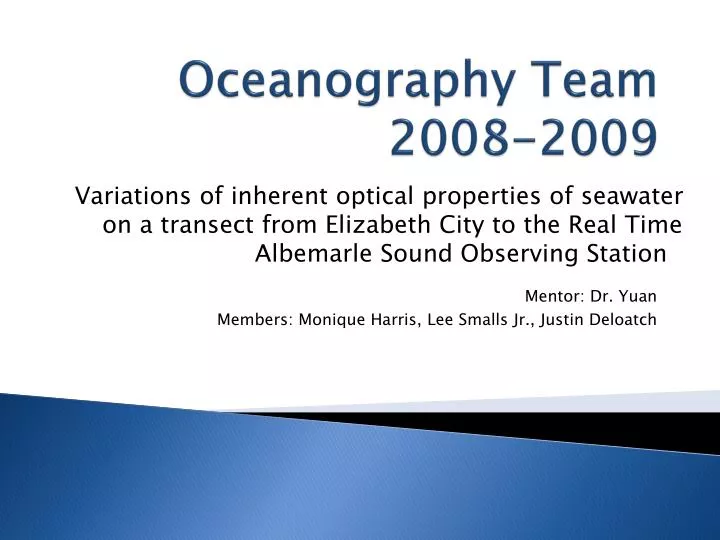
Oceanography Team 2008-2009. Variations of inherent optical properties of seawater on a transect from Elizabeth City to the Real Time Albemarle Sound Observing Station . Mentor: Dr. Yuan Members: Monique Harris, Lee Smalls Jr., Justin Deloatch. Abstract.

E N D
Oceanography Team 2008-2009 Variations of inherent optical properties of seawater on a transect from Elizabeth City to the Real Time Albemarle Sound Observing Station Mentor: Dr. Yuan Members: Monique Harris, Lee Smalls Jr., Justin Deloatch
Abstract Variations of inherent optical properties of seawater on a transect from Elizabeth City to the Real Time Albemarle Sound Observing Station The optical properties of seawater can be classified into two categories: apparent and inherent optical properties. While inherent optical properties (IOP) depend only on water, its dissolved and particulate components, apparent optical properties (AOP) depend on both IOP and environmental light field. Consequently, the determination of IOP of aquatic environment is essential for characterizing both seawater components and underwater light fields. Additionally, IOP of seawater determines remote sensing reflectance and it is an important factor for developing and calibration of remote sensing algorithms. Albemarle Sound is a coastal environment with a unique colored dissolved organic matter (CDOM) and particulates that are poorly documented. Specifically, the spatial variation of the concentrations of CDOM and particulates and their bio-optical properties are poorly known. We propose to conduct a field sampling and laboratory study of water samples of Albemarle Sound. Specifically, we have: (1). conduct vertical profiles of temperature, salinity and dissolved oxygen at selected stations along a transect from Elizabeth City to the Real-Time Albemarle Sound Observing Station; (2). collect surface water samples along the transect for studying the bio-optical properties; (3). determine the absorption spectrum of CDOM and particulate material; (4) compare the absorption spectrums of Albemarle Sound samples to that of from other regions.
Process • Collect water samplesfrom Albemarle Sound • Measure the absorption spectrum of filtered and unfiltered water samples. • Import the data to a program that could understand that format • Manipulate the data so we could see the data
Samples • Samples from Albemarle Sound • Eight Samples from different latitude and longitude.
First Steps • Each sample was filtered using a syringe with a filter inserted
Instruments • Windows 95 • Import the data • Export the data • Floppy disc (to transfer the Comma Separated Values(CSV) files)
Instruments • Spectrophotometer • Analyzes the water sample
Method • There were 49 animals in all and 100 legs. How many were chickens and rabbits where their in all? • This results in a pair of linear equations x+y=492x+4y=100
Microsoft Excel- Results Sample 1
Microsoft Excel- Data Table of data
Graphs How much Chl a, DOC, and POC? This will result in a equation at each wavelength and a total of hundreds of equations.
Graphs How much Chl a, DOC, and POC? This will result in a equation at each wavelength and a total of hundreds of equations.
Graphs How much Chl a, DOC, and POC? This will result in a equation at each wavelength and a total of hundreds of equations.
Graphs How much Chl a, DOC, and POC? This will result in a equation at each wavelength and a total of hundreds of equations.
Future Works • Interpolate all the data into same wavelengths interval. • Figure out how much Chlorophyll a, Pure Water, Dissolved Organic Carbon(DOC), Particulate Organic Carbon (POC), was in the samples from the spectrum from the absorbance of the water samples that we retrieved from the Albemarle Sound.