Download
1 / 27
270 likes | 433 Views
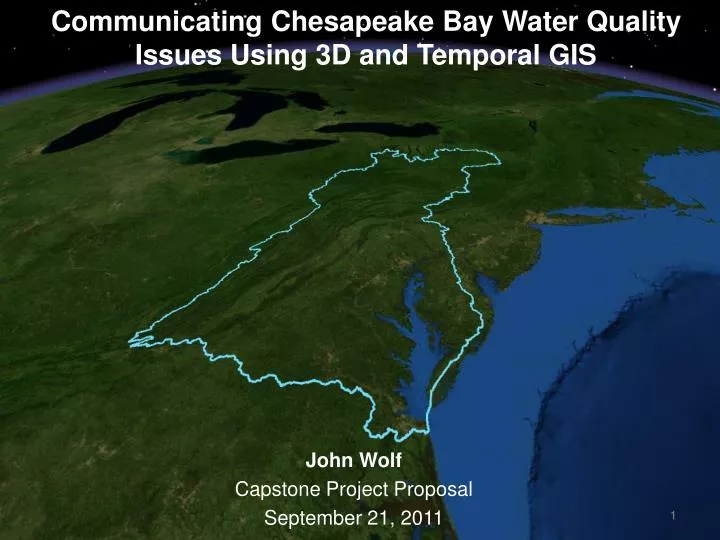
Communicating Chesapeake Bay Water Quality Issues Using 3D and Temporal GIS. John Wolf Capstone Project Proposal September 21, 2011. Presentation Overview. Background Chesapeake Bay overview Total Maximum Daily Load (TMDL) and the Bay restoration effort

E N D
Communicating Chesapeake Bay Water Quality Issues Using 3D and Temporal GIS John Wolf Capstone Project Proposal September 21, 2011
Presentation Overview • Background • Chesapeake Bay overview • Total Maximum Daily Load (TMDL) and the Bay restoration effort • Existing communication challenges -- visualizing Bay Health and Factors Affecting Bay Health • Goals and Objectives of Project • Proposed Approach and Methods • Existing data and models to be leveraged • Analysis/data manipulation • Project Timeline
Background Goals and Objectives Approach/Methods Timeline Chesapeake Bay What is an Estuary? • Partially enclosed body of water where fresh water from streams and rivers mixes with salt water from the ocean • Among the most productive environments on Earth • Variety of habitats that support diverse plant and animal communities • Largest of 130 estuaries in United States • Approximately 200 miles long • Average depth is 21 feet • Produces about 500 million lbs of seafood each year
Background Goals and Objectives Approach/Methods Timeline Chesapeake Bay Watershed • 64,000 square mile watershed – six states and D.C. • 17+ Million people • 150 major rivers and streams – Susquehanna contributes about 50% of all freshwater • Land-to-water ratio (14:1) makes the Bay particularly susceptible to what happens on the land
Background Goals and Objectives Approach/Methods Timeline Chesapeake Bay Total Maximum Daily Load (TMDL) • TMDL is a “pollution diet” for streams, creeks, and rivers • Required by the Clean Water Act and administered by the US Environmental protection Agency (EPA) for waters that don’t meet standards • Defines amount of pollution a water body can handle and still be healthy • Bay and tributaries are “overweight” with excess nitrogen, phosphorus and sediment, which … • Fuel algae blooms that impact water quality (low dissolved oxygen, water clarity) and aquatic life Largest and most complex TMDL in the U.S.
Background Goals and Objectives Approach/Methods Timeline Overview of Chesapeake Bay Restoration Framework Practice Implementation Goals Watershed Implementation Plans and State 2-Year Milestonesfor practice implementation Factors Affecting Bay Health Chesapeake Bay Total Maximum Daily Load(TMDL) for nitrogen, phosphorus, and sediment (Clean Water Act) Nutrient Load Reduction Goals (Conditions in the Watershed) Water Quality Goals Meet Bay water quality criteriafor dissolved oxygen, water clarity and chlorophyll-a concentrations Bay Health (Conditions in the Estuary) Ecological Endpoints Restoration of underwater grasses, fisheries, benthic communities, and faunal diversity Adopted from National Research Council 2011
Background Goals and Objectives Approach/Methods Timeline Geography and Communication Challenges Practice Implementation Goals Landscape stressors originate from multiple sectors, each with its own pathway to the Bay Chesapeake Bay Total Maximum Daily Load (TMDL) for nitrogen, phosphorus, and sediment (Clean Water Act) Nutrient Load Reduction Goals Water Quality Goals Meet Bay water quality criteria for dissolved oxygen, water clarity and chlorophyll-a concentrations Water Quality in the Bay varies throughout space and time Ecological Endpoints
Background Goals and Objectives Approach/Methods Timeline Bay Health: Water Quality Standards and the Chesapeake Bay TMDL 3 Geographic Dimensions Temporal Dimension
Background Goals and Objectives Approach/Methods Timeline Bay Health: Water Quality Standards and the Chesapeake Bay TMDL Open Water Deep Water Deep Channel Vertical Stratification and the Pycnocline Pycnocline - the region in a water column where water density changes rapidly, usually due to changes in salinity and temperature; in the Chesapeake Bay, the pycnocline region separates fresher, surface waters with a net flow down-Bay from saltier, bottom water with a net flow up-Bay.
Background Goals and Objectives Approach/Methods Timeline Bay Health: Chesapeake Bay Water Quality Data Base • Since 1984, Maryland and Virginia routinely monitor 19 measured water quality parameters at 49 stations in the Bay’s main stem • At least monthly sampling, with bi-weekly samples during June, July and August • Hydrographic profile at 1-2 meter intervals at each station
Background Goals and Objectives Approach/Methods Timeline Effective Science Communication • Guiding Principles(Thomas et al 2004) • Synthesis – combining different data approaches, which can lead the user to novel insights • Visualization – audience needs to see and interpret the data themselves • Context – including comparative data so that specific examples can be characterized as “high” or “low” relative to regional or global extremes User-centric Emphasis
Background Goals and Objectives Approach/Methods Timeline public private Project Goal Use commercial off-the-shelf GIS software to effectively communicate landscape and estuarine phenomena and to assist Chesapeake Bay Program scientists and managers to communicate (1) factors affecting Bay health and (2) measures of Bay health. communication visualization presenting knowns revealing unknowns high low human-map interaction MacEachren and Taylor, 1994
Background Goals and Objectives Approach/Methods Timeline Objectives Effectively communicate the … Significance of point and non-point pollution (nitrogen, phosphorus and sediment) loads to the Bay, Significance of human population growth throughout the Bay watershed, Extent of water quality designated use zones in the Bay, Seasonal extent of the dissolved oxygen “dead zone”. Factors Affecting Bay Health (Conditions in the Watershed) Bay Health (Conditions in the Estuary) … using 3D and temporal GIS
Background Goals and Objectives Approach/Methods Timeline Audiences/Clients • Primary: Chesapeake Bay Program (CBP) Scientists and Resource Managers • Water Quality Goal Implementation Team (Agriculture, Sediment, Urban Stormwater and Wastewater Workgroups) • Science, Technical Analysis and Reporting (STAR) Team (Monitoring and Modeling Teams) • Communication Team • Secondary: Interested Public Venues for Products • Partners • ChesapeakeStat website: stat.chesapeakebay.net • Public • Chesapeake Bay Program website: www.chesapeakebay.net
Background Goals and Objectives Approach/Methods Timeline Proposed Approach Gather Requirements – define Communication Stories Work with CBP Monitoring Team, Modeling Team, and others to develop/affirm assessment questions and their context • CBP Water Quality/Point Source Data Base • USGS SPARROW Model • US Census Data Assemble Data Iterate as necessary Data Manipulation - Conduct Analysis to Prepare Data for Visualization Grid development, surface generation (interpolation), conversion of interpolator output as necessary Apply a Visual Representation Static and dynamic map and chart views, animations, etc. From Shapiro, M. 2010.
Background Goals and Objectives Approach/Methods Timeline Factors Affecting Bay Health Watershed Pollution Loads • Objective 1: Effectively communicate the significance of point and non-point pollution (nitrogen, phosphorus and sediment) loads to the Bay • Data: USGS SPARROW Model and Chesapeake Bay Program Point Source Data Base • Approach/Methods: Generate watershed-wide perspective views of point and non-point pollution sources from points and interpolated surfaces • Anticipated Uses: Presentations and materials aimed at explaining where and from what source sectors pollution originates and their relative contributions
Background Goals and Objectives Approach/Methods Timeline Factors Affecting Bay Health Watershed Pollution Loads • Point Sources • 486 Significant Municipal and Industrial Point Sources in Chesapeake Bay Watershed • Typically presented in tabular view and 2D graduated color point symbols N Loads from Agriculture • Non-Point Sources • Spatially Referenced Regression (SPARROW) model for evaluation of nitrogen, phosphorus and sediment loads (Preston and Brakebill 1999) • Typically represented via 2D choropleth maps
Background Goals and Objectives Approach/Methods Timeline NY PA WV MD DC VA DE Factors Affecting Bay Health SPARROW – from 2D to Perspective Views Example – Nitrogen Loads from Agricultural Sources Hydrologic Segmentation Modeled N Loads from Agriculture aggregated to Watersheds Assignment of N Load Value to Watershed Centroid Surface Generation/ Interpolation
Background Goals and Objectives Approach/Methods Timeline 1800 1900 2000 Factors Affecting Bay Health Population Growth and Development • Objective 2: Effectively communicate the significance of human population growth throughout the Bay watershed • Data: US Census County population (1790-2010) • Approach/Methods: Generate perspective views of extruded county polygons and animate the decadal change • Anticipated Uses: Presentations and materials describing the role of population growth as a landscape stressor and the need to incorporate growth into future decisions
Background Goals and Objectives Approach/Methods Timeline Bay Health Water Quality Designated Use Zones • Objective 3: Effectively communicate the extent of water quality designated use zones in the Bay • Data: Chesapeake Bay Program Water Quality Data Base, Chesapeake Bay segmentation Scheme, and bathymetry • Approach/Methods: Utilize historical Chesapeake Bay monitoring station data to generate pycnocline boundaries and generate cross-sections illustrating the variability in designated use zones throughout the Bay • Anticipated Uses: Presentations and materials describing the regulatory implications of water quality standards and how they vary with geography and water depth
Background Goals and Objectives Approach/Methods Timeline Monitoring Station LE 2.2 Shallow Water Bathymetric Profile LE 2.2 0 Open Water -2 -4 Deep Water (pycnocline) -6 Depth (m) -8 -10 Deep Channel -12 -14 0 1,000 2,000 3,000 4,000 5,000 6,000 7,000 Chesapeake Bay Designated Use Zones Bay Health Water Quality Designated Use Zones Conceptual Framework Bay Bathymetry Actual Delineation of the Pycnocline and associated Designated Use Zones at Station LE 2.2 based on Monitoring Station- Specific Water Density Gradients (USEPA 2003)
Background Goals and Objectives Approach/Methods Timeline October January April July Bay Health Seasonal Variation in “Dead Zone” • Objective 4: Effectively communicate the seasonal extent of the area of hypoxia (“dead zone”) in the Bay • Data: Chesapeake Bay Program Water Quality Data Base • Approach/Methods: Utilize Chesapeake Bay interpolator output to generate bi-weekly/weekly depictions of the dead zone at multiple depths • Anticipated Uses: Presentations and materialsexplaining the temporal nature of water quality conditions and the seasonality of problems associated with meeting standards
Background Goals and Objectives Approach/Methods Timeline Bay Health Chesapeake Bay Interpolator • Cell based interpolator (VOL3D) that computes water quality concentrations throughout the Bay and tidal tributaries from water quality measured at point locations (Bahner 2006) • Code is optimized to compute concentration values which closely reflect the physics of stratified water bodies • Bay is very shallow compared to its width or length, hence water quality varies much more vertically than horizontally
Background Goals and Objectives Approach/Methods Timeline Project Timeline • Week 1: Gather requirements/communication stories • Week 2-3: Assemble and organize data • CBP Water Quality Database • Request/generate VOL 3D interpolator output for specific parameters and dates • Organize SPARROW model data • Week 4-5: • Develop draft visualizations – Bay Health and Factors Affecting Bay Health • Week 6: • Solicit feedback from Monitoring and Modeling Teams • Weeks 7-8: • Revisions to visualizations as necessary • Week 9 • Develop sample animations • Week 10: • Develop final product documentation and presentation at AAG
Andrienko, N. and G. Andrienko. 2006. Exploratory Analysis of Spatial and Temporal Data: A Systematic Approach. Springer-Verlag Berlin Heidelberg. Bahner, L. 2006. User Guide for the Chesapeake Bay and Tidal Tributary Volumetric Interpolator. NOAA Chesapeake Bay Office, Annapolis, MD. MacEachren A. and D. Taylor. 1994. Visualization in Modern Cartography. New York: Elsevier Science Inc. National Research Council. 2011. Achieving Nutrient and Sediment Reduction Goals in the Chesapeake Bay: An Evaluation of Program Strategies and Implementation. Committee on the Evaluation of Chesapeake Bay Program Implementation for Nutrient Reduction to Improve Water Quality The National Academies Press. Washington, D.C. Preston, S. and J. Brakebill. 1999. Application of Spatially Referenced Regression Modeling for the Evaluation of Total Nitrogen Loading in the Chesapeake Bay Watershed. USGS Water-Resources Investigations Report 99-4054. Shapiro, M. 2010. Once Upon a Stacked Time Series. In Beautiful Visualization. J. Steele and N. Ilinsky, eds. O’Reilly. Sebastopol, CA. Thomas, J., A. Jones, T. Saxby, T. Carruthers, E. Abal, and W. Dennison. 2004. Communicating Science Effectively: A practical handbook for integrating visual elements. University of Maryland Center for Environm3ntal Science. Tufte, E. 1983. The Visual Display of Quantitative Information. Graphics Press. Cheshire, CT. \ USEPA. 1983. Technical Support Document for Identification of Chesapeake Bay Designated Uses and Attainability. United States Environmental Protection Agency Region III Chesapeake Bay Program Office. EPA 903-R-03-004. Annapolis, MD References
Acknowledgement Dr. Patrick Kennelly MGIS Faculty Advisor