Download
1 / 16
160 likes | 271 Views
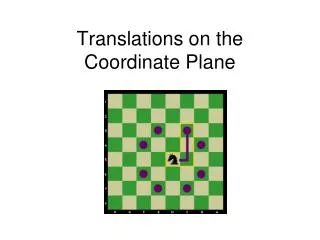
1. Characterization of the Effects of Translations on JPEG-Compressed Images. Keith Jacoby Advisor: Roger L. Easton, Ph. D. Rochester Institute of Technology Center for Imaging Science. 2. Experimentation. Introduction. Background. Conclusion. Results. Introduction. 3. image1.jpg.

E N D
1 Characterization of the Effects of Translations on JPEG-Compressed Images Keith Jacoby Advisor: Roger L. Easton, Ph. D. Rochester Institute of Technology Center for Imaging Science
2 Experimentation Introduction Background Conclusion Results Introduction...
3 image1.jpg “RECOMPRESSION OF SHIFTED IMAGE” image2.jpg Shifted and Recompressed Intentions...
4 Intentions of Research • Isolate the effect of shifts from the effects of JPEG’s quantization • Show trend of error due to increasing amount of shift (1 through 7 pixels in one direction) • Determine if there is a consistent relationship between shift and error across different images JPEG Background...
5 Brief Background of JPEG • 8 x 8 blocking DCT • DCT matrix of coef’s that represent freq. content of the block • higher frequency info. is thrown out • reconstruction of block from lower freq. components using inv. DCT LOWER HIGHER BASIS FUNCTIONS Artifacts...
6 Close-up of Shift Artifacts Shifted, recompressed JPEG image Original JPEG image Question: How does one quantify the artifacts due to shift? Experiments...
7 Several Experiments • Histograms of Error images* • Analyze DCTs of shifted JPEGs • Analyze DCTs of Error images • Ensemble Averaging of DCT image • Correlation of unshifted and shifted images * Results are shown in this presentation. Results from other experiments are to be covered in the Thesis. Measure error...
8 How is the error measured? 2nd Gen. JPEG image (shifted) 1st Gen. JPEG image (“original”) | D | Difference (or Error) Image histogram of error...
10 Histograms of Error Images !!! Error Histogram showing error due to a shift of just 2 pixels (over 75% of the pixels have changed their value***) Error image (inverted and equalized for better visi- bility of the artifacts) ***Note: This could be an interesting value to investigate... Mean Plot...
11 This graph shows the Mean pixel value of the error image as a function of pixel shift and quality factor for the photographic image. Std. Dev. Plot...
12 This graph shows the Std. Dev. of the pixel value of the error image as a function of pixel shift and quality factor for the photographic image. ANOVA of mean...
13 Two-way Analysis of Variance for Mean Analysis of Variance for Mean Source DF SS MS shift 6 1.2970 0.2162 Qfactor 9 28.6188 3.1799 Error 54 1.3273 0.0246 Total 69 31.2431 Variance due to shift Individual 95% CI shift Mean --+---------+---------+---------+--------- 1 2.023 (------*-----) 2 2.197 (-----*------) 3 2.304 (------*-----) 4 2.409 (------*-----) 5 2.299 (-----*------) 6 2.159 (------*------) 7 2.020 (------*-----) --+---------+---------+---------+--------- 1.950 2.100 2.250 2.400
14 Variance due to Quality Factor Individual 95% CI Qfactor Mean ----------+---------+---------+---------+- 10 3.451 (-*-) 20 2.920 (-*-) 30 2.601 (-*-) 40 2.444 (-*-) 50 2.233 (-*-) 60 2.063 (-*-) 70 1.894 (-*-) 80 1.680 (-*-) 90 1.329 (-*-) 100 1.400 (-*-) ----------+---------+---------+---------+- 1.800 2.400 3.000 3.600 Note: A similar statistical analysis will be done for the “percentage” value obtained from the histograms of error images. Results will be reported in the Web Thesis.
15 What do these results suggest? • For photographic images, the JPEG artifacts increase for increasing shifts up to a shift of 4 pixels in any axial direction. Beyond 4 pixels, the additional error due to shift decreases until 8 pixels, when the additional error disappears. This agrees with the initial hypothesis of the research project. Why it is important to know this...
16 Concluding Statements • This phenomenon is difficult to characterize because JPEG images are all different in their spatial frequency characteristics. • This attempt to characterize the error due to shift reinforces the importance of taking care not to crop JPEG images along their 8x8 border rows or columns. • All investigation into the artifacts due to shift by analyzing frequency domain (DCT) images proved inconclusive.
17 www.cis.rit.edu/~kaj3230 Senior Research Thesis posted on: For complete details on all experiments performed, discussion of results, and conclusions, follow link to Thesis. Thank You!!!