Download
1 / 51
520 likes | 734 Views
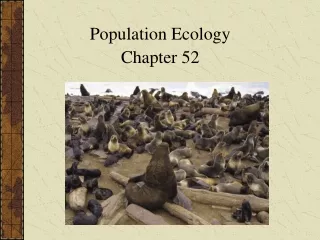
Chapter 52. Population Ecology: the study of populations in relation to the environment. This includes population density & distribution, age structure & fluctuations in population size. Population Density. 1.) Density: the # of individuals per unit area or volume.

E N D
Chapter 52 Population Ecology: the study of populations in relation to the environment. This includes population density & distribution, age structure & fluctuations in population size.
Population Density 1.) Density: the # of individuals per unit area or volume. 2.) How measure pop density in a natural population? a.) Often impractical to count ALL the individuals. b.) Use samples (count all of a species in small plots & extrapolate to find total number) c.) Mark & recapture: set traps to capture & mark individuals then release. Set traps again, catch both marked & unmarked individuals – use to estimate total # of individuals in population.
Population Density cont’d. 3.) Density is always changing: a.) Births & immigration add to population density. b.) Deaths & emigration remove individuals.
Population Dispersion 1.) Dispersion: the pattern of spacing among individuals within the boundaries of a population. This can depend on social interactions or just how suitable an environment is. 2.) Patterns of dispersion include: a.) Clumped b.) Uniform c.) Random
Why these dispersion patterns? 1.) Clumped a.) individuals are clumped where there are good environmental conditions for them b.) live in groups to hunt & protect each other 2.) Uniform a.) usually results from social interactions – defending a territory 3.) Random a.) usually occurs in areas where environmental conditions are uniform & dispersion of offspring random (plants)
Demography Definition: the study of the vital statistics (birth & death rates, etc) of a population and how they change over time. Uses a variety of graphics and calculations such as life tables, survivorship curves & reproductive tables…
Life Tables 1.) Age specific summaries of the survival pattern of a population. a.) Usually constructed by following a cohort from birth until all are dead. b.) Cohort: a group of individuals of the same age **Page 1139
Survivorship Curve 1.) Definition: a plot of the proportion or numbers in a cohort still alive at each age (you draw this using the info from the life table) 2.) Types of survivorship curves exhibited by populations: a.) Type I: flat at start (low death rates during early/mid life), drops steeply as death rates increase in old age. (This is us & many other large mammals that provide good parental care) b.) Type II: constant death rate over life span (many rodents, invertebrates, some plants) c.) Type III: drops sharply at start (high death rates when young) then flattens out (associated with organisms that produce A LOT of offspring w/ little or no parental care)
Reproductive Table Definition: an age specific summary of the reproductive rates in a population. Viewed in terms of females giving rise to more females – b/c only females produce offspring. a.) Usually constructed by measuring the reproductive output of a cohort from birth to death. b.) Is the product of the proportion of females of an age that are breeding & the # of female offspring of those breeding females **Page 1140 - 1141
There are LOTS of different patterns of reproduction… Why does one type of pattern evolve in a particular population??? That is what “life history” tries to study…
Life History The traits that affect an organism’s schedule of reproduction & survival make up its LIFE HISTORY. Life History Variables: 1.) When does reproduction begin? 2.) How often does organism reproduce? 3.) How many offspring are produced during each reproductive episode? Life history patterns are very diverse…
Semelparity Definition: “one shot” or big bang reproduction. 1.) Individuals produce MANY offspring in one reproductive episode & then typically die.
Why semelparity? 1.) Favored when the survival rate of offspring is low – usually b/c of a highly unpredictable environment a.) High numbers of offspring ensures that at least some will survive.
Iteroparity Definition: repeated reproduction. Individuals produce a few offspring but have more than one reproductive episode. Why iteroparity? 1.) Favored in dependable environments where competition for resources is intense. a.) Producing a few, large & well cared for offspring increases their chance of survival.
Life Histories Involve Trade-offs Organisms have limited resources and resources used for reproduction can’t be used for something else. There is a trade-off b/w reproduction & survival which is why life histories are diverse. Example: caring for offspring often negatively impacts parental survival!
Concept Check Question Consider 2 rivers – one is spring fed & has a constant water volume & temperature and the other drains a desert landscape and floods & dries at unpredictable intervals. Which is more likely to support many species of iteroparous animals? Why?
Population Growth Just think about this… Some bacteria can divide every 20 minutes. • So if you start w/ 1 bacteria, 20 minutes later you would have 2, after 40 minutes you would have 4, after 60 minutes you would have 8 bacteria…etc… • If bacteria continued at this rate unchecked, in 36 hours there would be enough bacteria to form a layer a foot deep over the entire globe! • Oh. My. God. • Why doesn’t this happen? On to some population growth issues, models, etc…
Per Capita Rate of Increase What is meant by “per capita?” Basically, “per individual in a population.” Applying to population growth: 1.) If we ignore imm- & emigration we can define changes in population size as: Change in pop Births during Deaths during size during time == time __ time interval interval interval
Per Capita Rate of Increase cont’d… Now, let’s make it look mathy… ∆N = B - D ∆ t ∆N = change in pop size ∆t = time interval over which we are measuring pop growth B = # of births in pop during time interval D = # of deaths in pop during time interval
Cont’d… Now, let’s express births as the average # of births per individual during the time interval – this is the per capita birth rate (b). Example: If there are 55 births in one year for a pop of 1,000 individuals, the annual per capita birth rate is 55/1,000 = 0.055 a.) If we know per capita birth rate (b) we can use the formula B = bN to calculate the expected # of births per year in a pop of any size. b.) Example: b = 0.055 and the population size is 1,500 B = bN B = (0.055)(1,500) B = 82 (births per year)
Cont’d… We can calculate the per capita death rate (symbolized by m for mortality) and use it in the same way as well! Now our equation can look really official… ∆N= bN - mN ∆t
But wait! One more simplification to the equation… The difference b/w the per capita birth rate and the per capita death rate is the per capita rate of increase (r). r = b - m • If r > 0 then the pop is growing • If r < 0 then the pop is declining • Zero pop growth occurs when r = 0.
And now, the final equation for change in population size… ∆N= rN ∆t So, this equation says that the change in pop size during a time interval = the per capita rate of increase multiplied by the pop size.
Exponential Growth What if a population had unlimited resources and space and mates and no predators??? Under these ideal conditions, the population experiences exponential growth. a.) The per capita rate of increase may reach the maximum rate for the species. b.) This max rate is called the intrinsic rate of increase and is symbolized as rmax c.) If you graph a pop like this over time you will get a characteristic J-shaped curve. d.) Graph at right shows – time on X-axis and pop size on Y.
Concept Check Question Where is exponential growth by a plant population more likely – on a newly formed volcanic island or in a mature, undisturbed rain forest? Why?
Logistic Growth Even if a pop experiences exponential growth for a time, it can’t go on forever – as there are more & more individuals, there are fewer & fewer resources. There is a limit to the # of individuals that can occupy a habitat. Carrying capacity (K): the maximum population size that a particular environment can support.
Logistic Growth Logistic growth model: as a population nears carrying capacity (K), the per capita rate of increase declines. a.) So, when pop size (N) = K, the pop stops growing. b.) If we graph this model of pop growth, we get a characteristic S-shaped (sigmoid) curve. c.) Again, the X-axis should be time on the graph at right…
Logistic growth & Real Populations Even the logistic growth model doesn’t fit most natural populations. a.) Many pops overshoot their K b.) Sometimes small pops don’t reproduce that well & can’t increase quickly --- can’t find mates, are more vulnerable when alone, etc. c.) The graph at right shows a more complex growth pattern but not all pops would fit even that…
Concept Check Question Explain why a population that fits the logistic growth model increases more rapidly at intermediate size than at smaller or larger sizes.
Logistic Model & Life Histories 1.) Different life histories are favored under the different conditions in the logistic growth model: a.) At high pop density (near K), selection favors adaptations that enable organisms to compete & survive w/ limited resources. b.) At low pop density adaptations promoting rapid reproduction are favored – lots of resources available.
Logistic Model & Life Histories cont’d… 1.) K-selection (density-dependent selection): selection for life history traits that are sensitive to pop density. a.) Operates in pops living at or near K.
Logistic Model & Life Histories cont’d… 2.) r-selection (density-independent): selection for traits that maximize r (the rate of increase). a.) Occurs in pops living below K, w/ little competition.
Concept Check Would k-selected populations be more likely to be iteroparous or semelparous? Why?
Regulation of Population Size Population size is regulated by biotic & abiotic factors. Questions to ask: a.) What environmental factors stop a population from growing? b.) Why do some populations fluctuate in size while others are stable?
Density-Dependent Population Regulation 1.) If birth rates and death rates are density-dependent, that means as pop size (density) increases: a.) birth rates decrease b.) death rates increase
Density-Dependent Population Regulation 2.) What are some density-dependent regulation factors? a.) Competition for resources b.) Territoriality c.) Health (diseases are transmitted more easily in large, crowded populations) d.) Predation e.) Toxic waste buildup (by-products of metabolic processes can build up – limits the amount of microorganisms in small spaces) f.) Intrinsic factors – some pops stop reproducing when they reach a certain # (even with unlimited resources). Example: release stress hormones that stop mating or increase aggression, etc.
Density-Independent Population Regulation Definition: these factors affect population numbers whether the population is crowded or not. Example: natural disaster
Population Dynamics The study of factors that cause variation in population size. a.) Factors can be biotic or abiotic b.) Some populations have regular cycles of growth & decrease.
Population Dynamics cont’d… c.) Predator-prey relationships are often cyclical.
Human Population Growth 1.) In a stable human population, birth rate equals death rate. There are 2 ways this can happen: a.) ZPG = high birth rate - high death rate b.) ZPG = low birth rate - low death rate c.) Movement from a to b is called demographic transition. i.) Happens with an increase in quality of health care & sanitation & increases access to education (usually for women).
Age Structure Definition: the relative number of individuals of each age in a population
Infant Mortality & Life Expectancy 1.) These stats vary widely around the world and are due to many different factors. 2.) Think about this… a.) Life expectancy in Afghanistan & Rwanda is 47 and 39 years respectively…ours is around 80 years… b.) While GLOBAL life expectancy increases, it is decreasing in many countries…
Human Carrying Capacity “Ecological footprint” concept: the land & water area each nation needs to produce ALL the resources it consumes & to absorb ALL the waste it generates. 1.) Arable land, pasture, forest (& conservation areas), ocean, built-up land & fossil energy land are distinguished to calculate footprint. 2.) All this land is added up & converted to hectares per person (1 hectare = 2.47 acres…1 acre is about 10 yards short of a football field, same width)