Download
1 / 61
610 likes | 733 Views
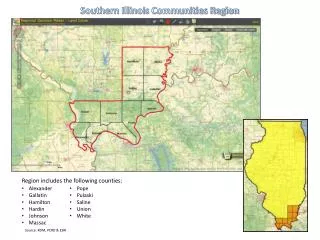
Regional Profile Illinois Southeastern Region. Northern Stateline. Northeast. Northwest. North Central. West Central. East Central. Central. Southeastern. Southwestern. Southern. Illinois Economic Development Regions. 93.3. 85.8. -3.3. Population Projections—Percent Change, 2000-25.

E N D
Northern Stateline Northeast Northwest NorthCentral WestCentral EastCentral Central Southeastern Southwestern Southern Illinois Economic Development Regions
93.3 85.8 -3.3 Population Projections—Percent Change, 2000-25 Source: U.S. Census Bureau
656,431 Population Projections by Region and Age, 2005-25 Source: Illinois Department of Commerce and Economic Opportunity
659,702 Projected Change in Illinois Population by Age and Race/Ethnicity, 2006-25 (in Thousands) Source: Illinois Department of Commerce and Economic Opportunity
Projected Change in Illinois Population By Age and Race/Ethnicity, 2005-25(Southeastern) Source: Illinois Department of Commerce and Economic Opportunity
Minorities as a Percent of the Total Population, 2006 (Public Use Microdata Areas) Source: 2006 ACS Public Use Microdata Sample
Percent African-American, 2006 (Public Use Microdata Areas) Source: 2006 ACS Public Use Microdata Sample
Percent Hispanic/Latino, 2006 (Public Use Microdata Areas) Source: 2006 ACS Public Use Microdata Sample
Percent Educational Attainment of Population Age 25-64 By Race/Ethnicity—Illinois, 2005 Source: U.S. Census Bureau, 2005 ACS (PUMS)
Vermont Difference in High School Attainment Between Whites and Minorities,* 2006 * Minorities include African-American, Hispanic, and Native American Source: U.S. Census Bureau, 2006 ACS (PUMS)
Vermont Difference in College Attainment Between Whites and Minorities,* 2006 * Minorities include African-American, Hispanic, and Native American Source: U.S. Census Bureau, 2006 ACS (PUMS)
Percent of Adults with No High School Diploma by Age and Race/Ethnicity, 2006 Source: U.S. Census Bureau, 2006 ACS (PUMS)
Percent of 18 to 24 Year Olds with No High School Diploma, 2006 (Public Use Microdata Areas) Source: 2006 ACS Public Use Microdata Sample
Percent of 25 to 64 Year Olds with No High School Diploma, 2006 (Public Use Microdata Areas) Source: 2006 ACS Public Use Microdata Sample
Percent of 25 to 64 Year Olds with an Associates Degree or Higher, 2006 (Public Use Microdata Areas) Source: 2006 ACS Public Use Microdata Sample
Percent of 25 to 64 Year Olds with a Bachelors Degree or Higher, 2006 (Public Use Microdata Areas) Source: 2006 ACS Public Use Microdata Sample
U.S. Average Per Capita Personal Income as a Percent of U.S. Average—Illinois, 1960-2005 Source: Regional Economic Information System, Bureau of Economic Analysis, U.S. Dept. of Commerce
Median Earnings of Population Age 25-64 by Level of Education, 2005 Source: U.S. Census Bureau, ACS
Personal Income per Capita, 2006 (Public Use Microdata Areas) Source: 2006 ACS Public Use Microdata Sample
Percent of Total Population at or Below Poverty Level, 2006 (Public Use Microdata Areas) Source: 2006 ACS Public Use Microdata Sample
Percent Employment in Management and Professional Occupations, 2006 (Public Use Microdata Areas) Source: 2006 ACS Public Use Microdata Sample
Difference in Median Earnings Between a High School Diploma and Associates Degree, 2006 (Public Use Microdata Areas) Source: 2006 ACS Public Use Microdata Sample
Difference in Median Earnings Between a High School Diploma and a Bachelor’s Degree, 2006 (Public Use Microdata Areas) Source: 2006 ACS Public Use Microdata Sample
Of 100 9th Graders, How Many… Student Pipeline, 2004 Source: NCES Common Core Data 2004; Tom Mortenson, Postsecondary Education Opportunity; NCES, IPEDS Fall 2004 Retention Rate File and Fall 2003 Enrollments, 2004 Graduation Rates; U.S. Census Bureau, 2005 ACS
High School Graduation Rates – Percentage of 9th Graders Graduating Four Years Later Region (Average 2005 and 2006) Source: IL State Board of Education; NCES, Common Core Data
College-Going Rates—First-Time Freshmen Directly Out of High School as a Percent of Recent High School Graduates, 2004 Source: Tom Mortenson, Postsecondary Opportunity (2004 data update 02-06-07)
Public 4-Year Private 4-Year For Profit Public 2-Year Private 2-Year For Profit Private 2-Year Non-Profit Public Less than 2-Year Private Less than 2-Year For Profit Private Less than 2-Year Non-Profit Total Private 4-Year Non-Profit Illinois Net Migration of College Students by Sector, Fall 2006 Source: NCES, IPEDS Residency and Migration Survey
University of Iowa IA 1,362 1,360 Public 4-year Indiana University-Bloomington IN 994 979 Public 4-year Purdue University-Main Campus IN 828 812 Public 4-year Marquette University WI 635 630 Private 4-year Non Profit University of Wisconsin-Madison WI 514 510 Public 4-year University of Missouri-Columbia MO 422 385 Public 4-year Carthage College WI 387 384 Private 4-year Non Profit Saint Louis University-Main Campus MO 363 358 Private 4-year Non Profit University of Phoenix-Online Campus AZ 361 29 Private 4-year For Profit Iowa State University IA 323 316 Public 4-year Miami University-Oxford OH 323 323 Public 4-year Saint Ambrose University IA 292 289 Private 4-year Non Profit Colorado Technical University Online CO 262 4 Private 4-year For Profit St Louis College of Pharmacy MO 260 102 Private 4-year Non Profit Michigan State University MI 256 246 Public 4-year University of Notre Dame IN 230 230 Private 4-year Non Profit Kaplan University IA 221 29 Private 4-year For Profit University of Michigan-Ann Arbor MI 219 207 Public 4-year Valparaiso University IN 207 205 Private 4-year Non Profit Arizona State University/Tempe Campus AZ 205 201 Public 4-year University of Colorado at Boulder CO 201 199 Public 4-year Northern Michigan University MI 200 195 Public 4-year University of Kansas Main Campus KS 199 199 Public 4-year Western International University AZ 192 27 Private 4-year For Profit Ranken Technical College MO 192 124 Private 4-year Non Profit Washington University in St Louis MO 187 187 Private 4-year Non Profit University of Dayton OH 186 186 Private 4-year Non Profit Butler University IN 174 173 Private 4-year Non Profit Southeast Missouri State University MO 158 156 Public 4-year University of Wisconsin-Platteville WI 157 155 Public 4-year Loras College IA 152 152 Private 4-year Non Profit Drake University IA 149 149 Private 4-year Non Profit Murray State University KY 147 141 Public 4-year Grand Valley State University MI 146 146 Public 4-year Carroll College WI 137 137 Private 4-year Non Profit Purdue University-Calumet Campus IN 135 114 Public 4-year Truman State University MO 130 130 Public 4-year Top Out-of-State Institutions Illinois Residents Attend, Fall 2006 First-Time FT Freshmen Just Institution State Freshmen Out of High School Sector Description Source: NCES, IPEDS Residency and Migration Survey
Less than High School High School Some College Associate Bachelor's Graduate/Professional Total Illinois Net Migration of Residents Age 22-64 by Level of Education, 2004-05 Source: 2005 ACS (PUMS)
Net Migration by Degree Level and Age Group—Illinois, 1995-2000 22- to 29-Year-Olds 30- to 64-Year-Olds Less than High School High School Some College Associate Bachelor’s Graduate/Professional Total Source: U.S. Census Bureau, 2000 Census; 5% PUMS Files
In-State College-Going Rates Directly Out of High School by Region; Average 2005 and 2006 (Public Institutions Only) Sources: IL State Board of Education, IL Shared Enrollment and Graduation Information
First-Time Undergraduate Enrollment by Region and Sector, Fall 2006 (Percent) Source: NCES, IPEDS Fall Enrollment Survey
Percent of First-Time Freshmen Directly Out of High School Enrolling In-Region; Average 2006 and 2007 (Public Institutions Only) Source: Illinois Shared Enrollment and Graduation Information
988 Regional Postsecondary Participation of First-Time Students Directly Out of High School (Students from the Southeastern Region in Public Institutions) Source: Illinois Shared Enrollment and Graduation Information
874 Regional Postsecondary Participation of First-Time Students Ages 25 and Older (Students from the Southeastern Region in Public Institutions) Source: Illinois Shared Enrollment and Graduation Information
REGION OF ENROLLMENT REGION OF RESIDENCE Northern East North West Northeast Stateline Northwest Central Central Central Central Southeastern Southern Southwestern Directly Out of High School Northeast 73 0 0 13 0 7 3 0 3 0 Northern Stateline 9 75 0 7 0 5 3 0 2 0 Northwest 7 0 69 9 0 6 7 0 3 0 East Central 1 0 0 86 0 8 1 0 5 0 Central 2 0 0 11 68 7 5 0 7 0 North Central 3 0 0 9 0 81 3 0 4 0 West Central 2 0 0 7 1 3 84 0 4 0 Southeastern 0 0 0 5 0 1 0 89 5 0 Southern 0 0 0 2 0 0 0 0 97 0 Southwestern 1 0 0 7 0 3 1 0 8 79 Northeast 99 0 0 0 0 0 0 0 1 0 Northern Stateline 3 97 0 0 0 0 0 0 0 0 Northwest 1 0 96 0 0 0 2 0 1 0 East Central 0 0 0 99 0 0 0 0 0 0 Central 0 0 0 0 98 0 0 0 0 1 North Central 0 0 0 0 0 99 0 0 0 0 West Central 0 0 0 0 0 0 99 0 1 0 Southeastern 0 0 0 0 0 0 0 100 0 0 Southern 0 0 0 0 0 0 0 0 100 0 Southwestern 0 0 0 0 0 0 0 0 2 98 Age 25 and Older Percent of Postsecondary First-Time Enrollment Patterns by Region of Residence; Average 2006 and 2007 (Public Institutions Only) Source: Illinois Shared Enrollment and Graduation Information
Distribution of Enrollment at Illinois Community Colleges, Fall 2006 Source: Illinois Board of Higher Education
Transfer Rates by Region (Percent) Fall 2001 Entering CC Cohort with No Prior College Experience Who Completed 12 or More Semester Credits and Transferred to Senior Institutions By Fall 2005 (FY 2007) Source: ICCB Fall Enrollment (E1), Annual Enrollment and Completion (A1), Illinois Shared Enrollment and Graduation Data, and National Student Clearinghouse; National Transfer Assembly/UCLA/Cohen Methodology; Rock Valley prior year data used in detail
Enrollment in State-Administered ABE Programs Per 1,000 Adults Age 18-64 with Less than a High School Diploma, 2005 Source: U.S. Department of Education; U.S. Census Bureau, ACS
GEDs Awarded per 1,000 Adults Age 25-44 with Less than a High School Diploma, 2005 Source: GED Testing Service; U.S. Census Bureau, ACS
Percent of Total Gross State Product by Industry and Comparison to U.S. Source: Bureau of Labor Statistics
Percent of Civilians Age 25-64 Not Participating in the Workforce—By Education Attainment, 2005 U.S.Illinois Less than High School 37.0 35.3 High School 24.7 24.1 Some College 21.0 20.0 Associate Degree 17.4 14.6 Bachelor’s Degree 16.5 15.7 Graduate/Prof. Degree 13.9 12.5 Source: U.S. Census Bureau, 2005 ACS (PUMS)
Change in Gross State Product, 1997-2004 Source: Bureau of Economic Analysis
36.7 to 58.4 28.9 to 36.7 24.0 to 28.9 11.1 to 24.0 Percent Employment in Management and Professional Occupations, 2006 (Public Use Microdata Areas) Source: 2006 ACS (PUMS)
Total Occupations with the Most Average Annual Openings Southeastern Region
Nursing Secondary & Vocational Education Computer Engineering Special Education Computer Systems Medical Lab Technology Industrial Engineering Mechanical Engineering Technology Civil Engineering Technology Chemical Engineering Civil Engineering Mechanical Engineering Electrical Engineering Medical Radiology Technicians Industrial Engineering Technology Electrical Engineering Technology Accounting & Financial Management Elementary Education Education Administration Demand vs. Supply in Selected Occupations—Gap Between Projected Annual Openings 2004-14 and Annual Degrees Produced 2005-06 More Demand than Supply More Supply than Demand Source: Occupational Supply and Demand System (data from Illinois Dept. of Commerce and Economic Opportunity and NCES IPEDS Completions Survey)
Employment F Earnings and Job Quality C Equity C Quality of Life D Resource Efficiency B Competitiveness/Existing Businesses A Entrepreneurial Energy C Human Resources C Financial Resources A Infrastructure Resources A Amenity Resources and Natural Capital C Innovation Assets C C A B Performance Business Vitality DevelopmentCapacity WEAKNESSES (Bottom 10 Rank) RankMeasure 41 Sewage Treatment Needs 41 Renewable Energy 43 Change in Average Annual Pay 43 Unemployment Rate 43 Average Annual Pay Growth 43 Change in New Companies 44 Change in Income from Dividends, Interest and Rent 44 New Companies 47 Employment Growth: Long Term 48 Net Migration 48 Change in Poverty Rate 48 Change in Health Professional Shortage Areas 49 Mass Layoffs STRENGTHS (Top 10 Rank) RankMeasure 2 Initial Public Offerings 3 Change in Homeownership Rate 4 Change in Energy Costs 5 Bridge Deficiency 5 Industrial Diversity 5 Urban Mass Transit 5 Electronic Public Services 6 Disparity between Rural and Urban Areas 7 Vehicle Miles Traveled 8 Strength of Traded Sector 8 Average Annual Pay 10 Average Teacher Salary Development Report Card for the States—Illinois Source: 2006 Development Report Card for the States, Corporation for Enterprise Development (CFED)
Illinois Rank—Federal Research and Development Expenditures, 2005 $1,122,675 $351,922 $664,954 $112,294 $115,629 $137,938 Source: National Science Foundation; U.S. Census Bureau Population Estimates