Download
1 / 34
360 likes | 714 Views
Introduction to Macro Economics National Income Accounting. Objectives of the Lecture To give introduction to macro economics. To give a basic theoretical foundation of national income accounting. To give basics about three approach for national income accounting and circular flow analysis.

E N D
Introduction to Macro Economics National Income Accounting Objectives of the Lecture • To give introduction to macro economics. • To give a basic theoretical foundation of national income accounting. • To give basics about three approach for national income accounting and circular flow analysis. • Problems, limitations and usefulness about national income accounting data. • To give some idea about Sri Lankan national income accounting.
What is Macro Economics • Macro economics is concerned with the behavior of the economy as a whole. It is a long run growth and short run behaviour of the economy - Business Cycle. • Actually it is about behavior of aggregate variables such as total output of goods and services, growth of output, the rates of inflation and unemployment, balance of payments, exchange rate, monetary and banking system, fiscal policies and public finance, interest rate, etc. • Macro economics has a policy part also. This mainly concern about what are the right policies to change aggregate macro variables and how policy changes will affect for the macro variables. Most interesting part may be policy area. It is really an application. • Macro economics also use abstraction based modeling to simplify the complex macro reality.
TWO MACRO POLICY TASKS • 1) ANALYSIS OF CAUSES OF CHANGE OF MACRO VARIABLES. • 2) PREDICT CONSEQUENCES OF POLICY CHANGE ON MACRO VARIABLES. • MACRO SUBJECT MATTER IS VERY IMPORTANT FOR EVERYBODY. • IT AFFECTS LIFE AND WELFARE OF PEOPLE. • MEDIA ATTENTION. • CENTRE OF POLITICAL DEBATE. • PRODUCTIVITY MEASUREMENT FOR RULING PARTY. • CONSIDERABLE DISAGREEMENTS EXIST AMONG ECONOMISTS ON THIS AREA
The Main Theme in Macro Economics Actual output Potential output Boom Slump Recession Recovery
Why do we have to Estimate National Income Accounting • It provides a formal structure for most of macro economics models and theories. • Provides reasonably accurate numbers about overall economy. • Provides something to compare economy with other economies. • In overall it is the internationally accepted coherent and comprehensive data base on the country’s economic structure, conduct and performance.
What National Income Accounts Consists Annual accounts and five to ten year long term accounts. Annual accounts provides: • (i) GDP/GNP (At Current and Constant Factor Cost) Industrial Origin. • (ii) Expenditure on GNP (At Current and Constant Market Prices). • (iii) GDP Implicit Deflator - A Measure of Inflation. • (iv) Estimates of Gross Domestic Fixed Capital Formation (GFCF) by Industrial Origin at Current and Constant Market Prices in respect of Private & Public Sectors and General Government. • (v) Composition of Gross Fixed Capital Formation by Capital Assets and Sectors of origin in respect of Private, Public Sectors and General Government. • (vi) Composition of General Govt. Current Consumption Expenditure by Functional cum Economic Heads.
What National Income Accounts Consists Five to ten year long term accounts provides basis for (i) Input Output (Inter industry) Tables. • - Supply and Use Matrices • - Inter Industry Flow Matrix • - Direct & Total Requirement Coefficient Matrices (ii) Institutional Sector Accounts. • - Non-Financial Enterprises • - Financial Institutions • - General Government • - Household & Un-incorporated Enterprises • - Flow of Funds Accounts • - Rest of the World (ROW) Accounts (iii) Social Accounting Matrix. • - Aggregated Social Accounting Matrix
Basic Concepts Gross Domestic Product (GDP) and Gross National Product (GNP). • GDP is the value of all final goods and services produced in the economy in a given time period, normally for year. • To convert GDP into GNP, it is necessary to add income received by domestic residents from assets owned abroad and to subtract income paid out to non-residents who own assets in the country. • The difference between GDP and GNP is the net factor income from abroad.
Nominal (Current) GDP and Real (Constant) GDP • Nominal GDP is the output of currently produced goods and services evaluated at current market prices or in current PK Rs. terms. Since GDP is the Rs. value of goods and services measured in price units, as prices change, GDP changes WITHOUT any change in production in the economy. • The adjustment of nominal GDP for the effects of changes in price level or inflation, results in REAL GDP. That means by deflating the nominal GDP, you can obtain real GDP. • GDP Deflator: The ratio of nominal GDP to real GDP is just the ratio of the current price level of the goods and services relative to the price level in the base year.
GDP and NDP GDP – Depreciation = NDP (Net Domestic Production) This is a total value of production minus the value of the amount of capital used up in producing that output. National Income (NI) = NDP – indirect taxes.
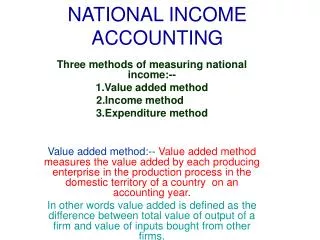
Measurement of GDP GROSS DOMESTIC PRODUCT (GDP) CAN BE CALCULATED IN THREE DIFFERENT WAYS. • SUM OF VALUE ADDED BY ALL PRODUCERS – PRODUCTION APPROACH. • INCOME CLAIMS GENERATED BY THE TOTAL PRODUCTION – INCOME APPROACH. • EXPENDITURE NEEDED TO PURCHASE ALL FINAL GOODS AND SERVICES PRODUCED – EXPENDITURE APPROACH.
THREE APPROACH i) Production Approach: It measures the contribution to output made by each producer. It is obtained by deducting from the total value of its output the value of goods and services it has purchased from other producers and used up in producing its own output, i.e; VA = value of final output - value of intermediate consumption. Total value added by all producers equals GDP. ii) Income/Cost Approach: In this approach, consideration is given to the costs incurred by the producer within his own operation. Or the income paid out to employees, indirect taxes, consumption of fixed capital, and the operating surplus. iii) Expenditure Approach: This approach looks at the final uses of the output for private consumption, government consumption, capital formation and net of imports & exports.
Why three methods • To improve accuracy. • Various methods are giving various information for policy making and analysis. • To select the most suited methods looking at country’s situation.
THE CIRCULAR FLOW OF INCOME • THE PROCESS THAT DETERMINES NATIONAL INCOME AND NATIONAL OUTPUT. • SIMULTANEOUSLY CAN BE REPRESENTED BY A DIAGRAM ILLUSTRATING THE CIRCULAR FLOW OF EXPENDITURE AND INCOME. • Simple circular flow model and complete circular flow model.
Simple Circular Flow Payments Supply of FOP HH Firms Goods and Services Expenditure Here no injection (I or X) and leakage (S or M). Therefore, Production (Value Added) = Expenditure = Income
A Simple Economy Y = C + I (4) Y = Value of Output, C = Consumption, I = Investment spending. Relationship among Saving, Consumption and GDP Y = S + C (5) S = Private Sector Savings The whole of income is allocated to either consumption or saving. C + I = Y = C + S (6) Components of Allocation of Demand Income Output produced is equal to output sold. The value of output produced is equal to income received. Income received is spent on goods or saved.
Relationship between saving and investment By reformulating identity (6); I ≡ Y - C ≡ S (7) Here, Investment is identically equal to saving. In a simple economy, There is no government involvement and No foreign trade.
Complete Circular Flow Imports: Exports: C-IM: Consumption: G O V E R N M E N T Taxes: BUSINESS SECTOR Government HOUSEHOLD SECTOR Disposable Income: Total Business Revenue: spending Transfer payments: Factor Incomes: Investment: Savings: Factor payments: Wages: Interest: Rent: Profits:
Reintroducing the Government and Foreign Trade Y ≡ C + I + G + NX (8) G = Government purchases of goods and services TA = All taxes TR = Transfers to the private sector (including interest) YD = Disposable Income Disposable Income YD = Y + TR - TA (9) Disposable income, is allocated to consumption and saving: YD = C + S (10)
Combining identities (9) and (10); C + S ≡ YD ≡ Y + TR – TA (11) Or, C ≡ YD – S ≡ Y + TR – TA –S (11a) It states that consumption is disposable income less saving or, alternatively, that consumption is equal to income plus transfers less taxes and saving. By substituting ‘C’ in (11a) to identity (8); S – I ≡ (G + TR – TA ) + NX (12) Using this identity, we can explain the relationship between savings and investment gap, government budget deficit and trade balance. Read example in page 32
Components of Aggregate Demand • Consumption spending by households (C) • Investment spending by businesses and households (I) • Government (federal, state, and local) purchases of goods and services (G) • Foreign demand for net exports (NX). Y = C + I + G + NX (3)
Breaking down of the Demand for Goods and Services in USA in 1999 by Components of Demand C = Consumption G = Government NX = Net Exports I = Investment
Saving, Investment, the Government Budget and Trade (G + TR - TA ) = Government Budget Deficit (BD) (G + TR) = Total Government Expenditure TA = Taxes received by the government The difference (G + TR – TA) is the excess of the Government’s spending over its receipts, of its budget deficit. Private sector has three ways of disposing of its saving; make loans to the government, lend to foreigners, who are buying more from us than we are buying from them, lend to business firm. In all three cases, households will be paid back later, receiving interest or dividends in addition to the amount they lent.
Price Indexes No single price index is perfect. The three main price indexes are ; • GDP deflator • Consumer Price Index • Producer Price Index The GDP Deflator It is the ratio of nominal GDP in a given year to real GDP of that year. The Consumer Price Index (CPI) The CPI measures the cost of buying a fixed basket of goods and services representative of the purchases of urban consumers.
How CPI differs from GDP Deflator • GDP deflator measures the prices of a much wider group of goods than the CPI does. • CPI measures the cost of a given basket of goods which is the same from year to year, the basket of goods included in the GDP deflator, differs from year to year depending on what is produced in in the economy in each year. • CPI directly includes prices of imports; the deflator includes only prices of goods produced in the country.
Producer Price Index • This also measure cost of a given basket of goods but its’ coverage is wider. • PPI includes raw materials and semi-finished goods as well. • This is an early stage of price measurement specially at farm gate level prices.
ESTIMATION OF GDP/GNP (UNSNA Classification) • Agriculture, Forestry and Fishing • Mining and quarrying • Manufacturing • Construction • Electricity, Gas, Water, and Sanitary Services • Transport, Storage and Communication • Wholesale and retail sale • Banking Insurance and real Estate • Ownership of dwellings • Public Administration and Defense • Other Services • GDP • GNP (Adjusted for net factor income from aboard)
PROBLEMS OF MEASURING GDP/GNP • What goods and services are to be included? • Which stage of production should be included? • When they were included? • Exclusion of non-productive transactions: • Purely financial transactions: Securities trade and Capital gains. Sales of goods produced in previous years. Transfer payments: Welfare payments; Pensions, Interest payments by Govt. and Consumers. • 5. Exclusion of non-market and illegal activities: • Do-it-yourself activities: House Wife’s and girl/boy friend’s Services, Illegal Activities: Gambling, Leisure activities, Prostitution and Drugs, Home grown activities are ignored. • 6) Products quality improvements are not accounted. • 7) Environmental damage is not counted in many LDCs.
Limitations of GDP Per-capita as a measure of economic development 1) It does not show the distribution of income. 2) Problems with measurements (Under or overvaluation) Other measures PQLI HDI Gender related measures Empowerment measurement Nutrition and health measures Various others
Boom Recession Slump Recovery
Country Classification: • Low Income Countries • (Less than $ 755 GNP per Capita) • Middle Income Countries • Lower Middle Income: ($ 756 - $ 2995) • Higher Middle Income: ($ 2996 - $ 9265) • Higher Income Countries • ($ 9266 and above)
Economic Growth • Aggregate output growth (Real GDP growth) Output growth = (labour share x labour growth) + (capital share x capital growth) + Technical progress. This equation shows growth of output mainly due to inputs growth and improved productivity or technical progress. • Real GDP per-capita growth Per-capita output growth = (Capital share x Capital labour ratio) + Technical Progress This equation shows growth of GDP per-capita depends on availability of capital per labour and technical progress.
Factors for Economic Growth • Capital accumulation (savings and investment). • Technical progress or total factor productivity. • Natural resources (putting more lands into business, discovery and development of natural gas, oil, minerals…). Limits of natural resources for growth. • Human capital (investing on people). • Other factors (good governance, weather, progressive thinking, population growth, skill labour immigration, …etc)
Other Macro Topics • Aggregate demand and supply. • Unemployment and Inflation. • Basics in equilibrium in money and goods markets (IS-LM). • Monetary and fiscal policy. • Behavioral foundations in macro economics: consumption, savings and investment. • International linkages: exchange rate and Balance of Payments. • Basics in money market operations including interest rates. • Basics in financial markets and asset pricing. • International adjustment and interdependence of macro variables. • An overview of new macro economics (rational expectation, imperfect information, random walk of GDP, real business cycle