Download
1 / 22
220 likes | 354 Views
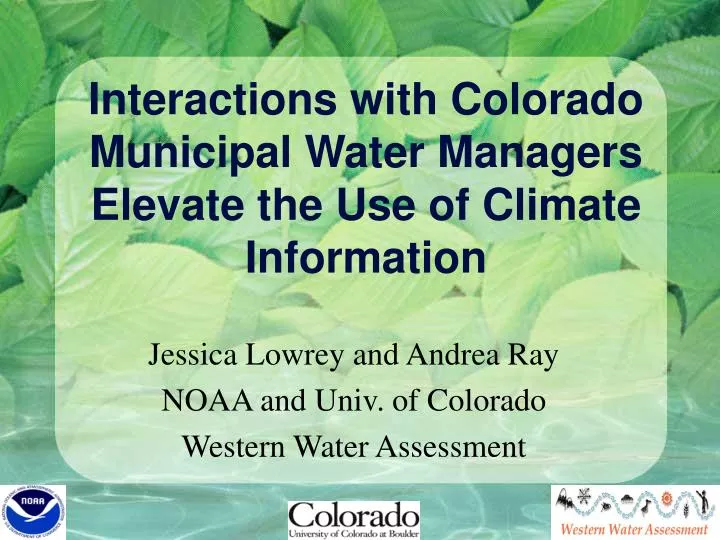
Interactions with Colorado Municipal Water Managers Elevate the Use of Climate Information. Jessica Lowrey and Andrea Ray NOAA and Univ. of Colorado Western Water Assessment. Overview. Study group Methods Uses of climate information and forecasts

E N D
Interactions with Colorado Municipal Water Managers Elevate the Use of Climate Information Jessica Lowrey and Andrea Ray NOAA and Univ. of Colorado Western Water Assessment
Overview • Study group • Methods • Uses of climate information and forecasts • Factors affecting the use of climate information and forecasts • Interactions with WWA affect this use • Recommendations Dillon Reservoir-Denver Water supply
Northern Boulder Westminster Denver Aurora Colorado Springs Study Group • Six Front Range water providers: Northern Colorado Water Conservancy District, Boulder, Westminster, Denver, Colorado Springs, and Aurora • Serve about 60% of Colorado’s population Context: • Interactions with WWA and other climate information providers since 1998 • Drought in 2002
Methods: Interactive Model • Researched decision processes and institutional capacity • Interdisciplinary team at WWA and NOAA communicating with water managers • Interviews • Workshops and meetings
Results:Use of climate information & forecasts • Data used in annual and long-term decisions • Instrumental record of hydrology • Current snowpack and streamflows • Streamflow/reservoir inflow forecasts Graph from NRCS
Use of climate information & forecasts Probabilistic streamflow forecasts in the form of exceedence probabilities for precise locations.
Use of climate information & forecasts Seasonal climate forecasts are used qualitatively… • Water managers look at and discuss climate forecasts • They use them in mental models, when they are “on the fence” about drought restrictions …But they are not in a form that can be incorporated into models. • Climate forecasts do not provide data on river basin scale • Water managers can’t use temperature and precipitation in models, only streamflows • Skill/verification information is hard to locate and interpret • Climate forecasts are most often “EC” for precipitation in this region
Factors affecting use of climate information & forecasts • Quality of information and forecasts • Institutional capacity • Sensitivity of water supply to climate variability • Perception of risk • Climate literacy
Institutional capacity Definition: the ability of a decision-making entity to incorporate new information into decision processes. Higher capacity • More staff, diverse areas of expertise • More time for learning • Use of sophisticated operational or planning models Cities with higher institutional capacity are more likely to try to use new climate information and forecasts.
Sensitivity of water supply to climate variability Definition: impact of natural climate variability on water supply. • This region is sensitive due to snowmelt dominated water supply, population growth, fully appropriated rivers Higher sensitivity • Ratio of average storage : annual demand = 1:1 • Water rights have junior priority • Water supply comes from only one basin • Anticipating high growth
2002 1950’s While these cities had different levels of sensitivity, they were all impacted by the drought of 2002 (e.g. water use restrictions). That experience made them realize that their system may not be reliable if they only plan for droughts in the historic record.
Perception of risk Drought of 2002 made water managers realize that their systems were vulnerable to drought. • Single year with lower snowpack and streamflows than anything water managers had experienced or seen in the hydrologic record. This led to a change in perception of risk to climate variability… …And a desire to learn more. • After 2002, WWA started to get more information requests (paleo reconstructions, climate forecasts, natural variability, climate change)
Climate literacy As perception of risk increased… • WWA provided education about climate variability, climate system and climate prediction …Climate literacy increased. • Water managers are now asking more specific questions and are considering using additional climate information.
…this lead to increased use of climate information and forecasts. • Paleo reconstructions of streamflows in long-term models. • Downscaled GCM projections in hydrology models. • Climate variables in annual reservoir projections
Putting it all together: • Perception of higher risk, coupled with higher sensitivity of water supply to climate variability increases the desire to use climate information and forecasts. • A severe drought led to perception of higher risk, and water managers sought out climate knowledge from WWA and others. • Climate literacy, plus perception of higher risk, and institutional capacity enabled these water managers to seek out and use new climate information and forecasts.
Sensitivity of water supply Drought of 2002-2006 Perception of risk Interactions with WWA Climate literacy Institutional capacity Use of climate information and forecasts
Recommendation 1: Education on climate system and natural variability • Effect of climate patterns (e.g. ENSO) on regional weather • Regional trends in temperature, precipitation, and streamflows; compare anomalous years to natural variability • Re-occurance interval of single- and multi-year droughts and other extremes • Regional variability in historic streamflows among river basins (exceedence probabilities); reliability of current or future water rights
Recommendation 2: Education on forecast methodology and skill • Underlying assumptions and uncertainties of forecast models • Sources of forecast and data error • Verification methods, including hind casting • Types of verification (resolution/sharpness vs. reliability) • Skill vs. accuracy • Regional patterns of skill
Example of streamflow forecast that water managers use: Example of climate forecasts presented in a similar manner:
Questions? Contact us at: Jessica.Lowrey@noaa.gov Andrea.Ray@noaa.gov http://wwa.colorado.edu