Download
1 / 1
10 likes | 135 Views
Correlation of TCR diversity with immune reconstitution after cord blood transplant Ryan Emerson 1 , Filippo Milano 2 , Anna Sherwood 1 , Adrienne Papermaster 2 , Katherine Guthrie 2 , Edus Warren 2 , Colleen Delaney 2 , Harlan Robins 1,2

E N D
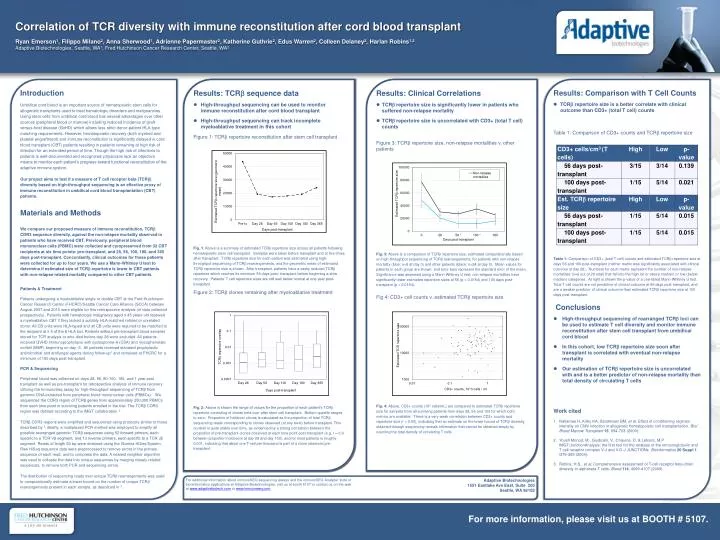
Correlation of TCR diversity with immune reconstitution after cord blood transplant Ryan Emerson1, Filippo Milano2, Anna Sherwood1, Adrienne Papermaster2, Katherine Guthrie2, Edus Warren2, Colleen Delaney2, Harlan Robins1,2 Adaptive Biotechnologies, Seattle, WA1, Fred Hutchinson Cancer Research Center, Seattle, WA2 Introduction Umbilical cord blood is an important source of hematopoietic stem cells for allogeneic transplants used to treat hematologic disorders and malignancies. Using stem cells from umbilical cord blood has several advantages over other sources (peripheral blood or marrow) including reduced incidence of graft-versus-host disease (GvHD) which allows less strict donor-patient HLA-type matching requirements. However, hematopoietic recovery (both myeloid and platelet engraftment) and immune reconstitution is significantly delayed in cord blood transplant (CBT) patients resulting in patients remaining at high risk of infection for an extended period of time. Though the high risk of infections to patients is well-documented and recognized, physicians lack an objective means to monitor each patient’s progress toward functional reconstitution of the adaptive immune system. Our project aims to test if a measure of T cell receptor beta (TCRb) diversity based on high-throughput sequencing is an effective proxy of immune reconstitution in umbilical cord blood transplantation (CBT) patients. Materials and Methods We compare our proposed measure of immune reconstitution, TCRbCDR3 sequence diversity, against the non-relapse mortality observed in patients who have received CBT. Previously, peripheral blood mononuclear cells (PBMC) were collected and cyropreserved from 32 CBT recipients at six time points: pre-transplant, and 28, 56, 100, 180, and 365 days post-transplant. Concordantly, clinical outcomes for these patients were collected for up to four years. We use a Mann-Whitney U test to determine if estimated size of TCRbrepertoire is lower in CBT patients with non-relapse related mortality compared to other CBT patients. Patients & Treatment Patients undergoing a myeloablative single or double CBT at the Fred Hutchinson Cancer Research Center (FHCRC)/Seattle Cancer Care Alliance (SCCA) between August 2007 and 2010 were eligible for this retrospective analysis (of data collected prospectively). Patients with hematologic malignancy aged ≤ 45 years old received a myeloablative CBT if they lacked a suitably HLA-matched related or unrelated donor. All CB units were HLA-typed and all CB units were required to be matched to the recipient at ≥ 4 of the 6 HLA loci. Patients without pre-transplant blood samples stored for TCR analysis or who died before day 28 were excluded. All patients received GVHD immunoprophylaxis with cyclosporine-A (CSA) and mycophenolatemofetil (MMF) beginning on day -3. All patients received standard prophylactic antimicrobial and antifungal agents during follow-up1 and remained at FHCRC for a minimum of 100 days post-transplant. PCR & Sequencing Peripheral blood was collected on days 28, 56, 80-100, 180, and 1 year post transplant as well as pre-transplant for retrospective analysis of immune recovery utilizing the ImmunoSeq assay for high-throughput sequencing of TCRβ from genomic DNA extracted from peripheral blood mononuclear cells (PBMCs). We sequenced the CDR3 region of TCRβ genes from approximately 250,000 PBMCs from each time point in surviving patients enrolled in the trial. The TCRβ CDR3 region was defined according to the IMGT collaboration 2. TCRβ CDR3 regions were amplified and sequenced using protocols similar to those described by 3. Briefly, a multiplexed PCR method was employed to amplify all possible rearranged genomic TCRβ sequences using 52 forward primers, each specific to a TCR Vβ segment, and 13 reverse primers, each specific to a TCR Jβ segment. Reads of length 60 bp were obtained using the IlluminaHiSeq System. Raw HiSeq sequence data were preprocessed to remove errors in the primary sequence of each read, and to compress the data. A nearest neighbor algorithm was used to collapse the data into unique sequences by merging closely related sequences, to remove both PCR and sequencing errors. The distribution of sequencing reads over unique TCRb rearrangements was used to computationally estimate a lower bound on the number of unique TCRb rearrangements present in each sample, as described in 3. . • Results: TCRbsequence data • High-throughput sequencing can be used to monitor immune reconstitution after cord blood transplant • High-throughput sequencing can track incomplete myeloablative treatment in this cohort • Figure 1: TCRbrepertoire reconstitution after stem cell transplant • Fig. 1: Above is a summary of estimated TCRbrepertoire size across all patients following hematopoietic stem cell transplant. Samples were taken before transplant and at five times after transplant. TCRbrepertoire size for each patient was estimated using high-throughput sequencing of TCRbrearrangements, and the geometric mean of estimated TCRbrepertoire size is shown. After transplant, patients have a vastly reduced TCRbrepertoire which reaches its minimum 56 days post- transplant before beginning a slow recovery. Patients’ T cell repertoire sizes are still well below normal at one year post-transplant. • Figure 2: TCRbclones remaining after myeloablative treatment • Fig. 2: Above is shown the range of values for the proportion of each patient’s TCRb repertoire consisting of clones held over after stem cell transplant. Bottom quartile ranges to zero. Proportion of holdover clones is calculated as the proportion of total TCRbsequencing reads corresponding to clones observed (at any level) before transplant. This number is quite stable over time, as evidenced by a strong correlation between the proportion of pre-transplant clones observed at each time point post-transplant (e.g. r = 0.9 between proportion holdovers at day 28 and day 100), and for most patients is roughly 0.001, indicating that about one T-cell per thousand is part of a clone observed pre-transplant • Results: Clinical Correlations • TCRb repertoire size is significantly lower in patients who suffered non-relapse mortality • TCRb repertoire size is uncorrelated with CD3+ (total T cell) counts • Figure 3: TCRb repertoire size, non-relapse mortalities v. other patients • Fig. 3:Above is a comparison of TCRbrepertoire size, estimated computationally based on high-throughput sequencing of TCRb rearrangements, for patients with non-relapse mortality (blue; n=8 at day 0) and other patients (black; n=24 at day 0). Mean values for patients in each group are shown, and error bars represent the standard error of the mean. Significance was assessed using a Mann-Whitney U test; non-relapse mortalities have significantly lower estimated repertoire sizes at 56 (p = 0.0154) and 100 days post-transplant (p = 0.0154). • Fig 4: CD3+ cell counts v. estimated TCRb repertoire size • Fig. 4: Above, CD3+ counts (103 cells/mL) are compared to estimated TCRbrepertoire size for samples from all surviving patients from days 28, 56 and 100 for which both metrics are available. There is a very weak correlation between CD3+ counts and repertoire size (r = 0.05), indicating that an estimate on the lower bound of TCRb diversity obtained through sequencing reveals information that cannot be obtained simply by counting the total density of circulating T cells. • Results: Comparison with T Cell Counts • TCRb repertoire size is a better correlate with clinical outcome than CD3+ (total T cell) counts • Table 1: Comparison of CD3+ counts and TCRb repertoire size • Table 1: Comparison of CD3+ (total T cell) counts and estimated TCRbrepertoire size at days 56 and 100 post-transplant (neither metric was significantly associated with clinical outcome at day 28). Numbers for each metric represent the number of non-relapse mortalities (n=6 out of 29 total) that fall into the high (at or above median) or low (below median) categories. At right is shown the p-value of a one-tailed Mann-Whitney U test. Total T cell counts are not predictive of clinical outcome at 56 days post-transplant, and are a weaker predictor of clinical outcome than estimated TCRbrepertoire size at 100 days post-transplant. • Conclusions • High-throughput sequencing of rearranged TCRb loci can be used to estimate T cell diversity and monitor immune reconstitution after stem cell transplant from umbilical cord blood • In this cohort, low TCRb repertoire size soon after transplant is correlated with eventual non-relapse mortality • Our estimation of TCRb repertoire size is uncorrelated with and is a better predictor of non-relapse mortality than total density of circulating T cells • Work cited • NakamaeH, Kirby KA, Sandmaier BM, et al. Effect of conditioning regimen intensity on CMV infection in allogeneic hematopoietic cell transplantation. Biol Blood Marrow Transplant 15, 694-703 (2009). • Yousfi Monod, M., Giudicelli, V., Chaume, D. & Lefranc, M.P. IMGT/JunctionAnalysis: the first tool for the analysis of the immunoglobulin and T cell receptor complex V-J and V-D-J JUNCTIONs. Bioinformatics20 Suppl 1, i379-385 (2004). • Robins, H.S., et al. Comprehensive assessment of T-cell receptor beta-chain diversity in alphabeta T cells. Blood114, 4099-4107 (2009). For additional information about immunoSEQsequencing assays and the immunoSEQ Analyzer suite of bioninformatics applications at Adaptive Biotechnologies, visit us at booth 5107 or contact us on the web at www.adaptivebiotech.com or www.immunoseq.com. Adaptive Biotechnologies 1551 Eastlake Ave East, Suite 200 Seattle, WA 98102 For more information, please visit us at BOOTH # 5107.