Download
1 / 3
30 likes | 144 Views
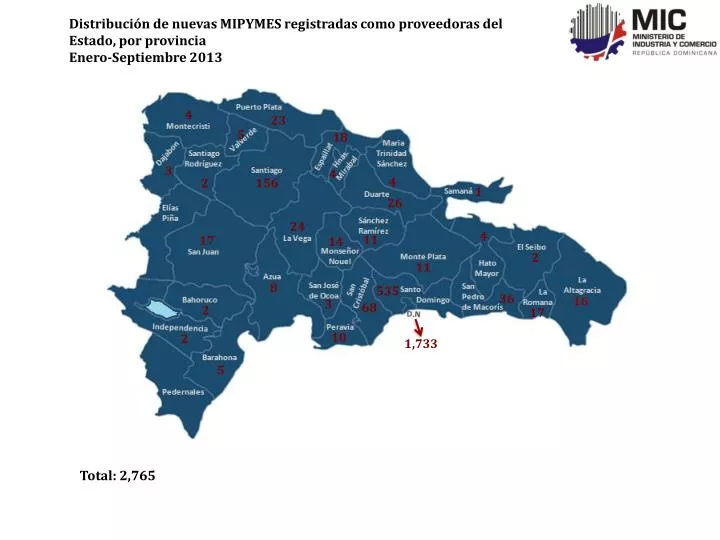
Distribución de nuevas MIPYMES registradas como proveedoras del Estado, por provincia Enero-Septiembre 2013. 4. 23. 5. 18. 3. 4. 4. 156. 2. 1. 26. 24. 4. 11. 17. 14. 2. 11. 8. 535. 36. 16. 3. 68. 2. 17. 10. 2. 1,733. 5. Total: 2,765.

E N D
Distribución de nuevas MIPYMES registradas como proveedoras del Estado, por provincia Enero-Septiembre 2013 4 23 5 18 3 4 4 156 2 1 26 24 4 11 17 14 2 11 8 535 36 16 3 68 2 17 10 2 1,733 5 Total: 2,765
Empleados por las nuevas MIPYMES registradas como proveedoras del Estado, por provincia Enero-Septiembre 2013 11 98 34 292 5 182 37 1,625 16 28 256 16 75 141 161 2 123 11 41 2,537 43 137 58 511 11 164 40 8 12,630 16 Total: 22,142
Nuevas empresas aprobadas como Zonas Francas por Provincia Enero-Septiembre 2013 2 20 1 1 3 16 4 1 Total: 47