Download

1 / 22
230 likes | 424 Views
Financial Constraints, Entry and Post-Entry Growth. Motivation. Firm dynamics is good for productivity growth because: (1) New firms replace inefficient incumbents (2) It promotes efficiency-enhancing investment by incumbents Previous studies emphasize:

E N D
Financial Constraints, Entry and Post-Entry Growth P.Aghion, T.Fally, S.Scarpetta Conference on Access to Finance, Wordlbank, March 15-16, 2007
Motivation • Firm dynamics is good for productivity growth because: (1) New firms replace inefficient incumbents (2) It promotes efficiency-enhancing investment by incumbents • Previous studies emphasize: • Adjustment costs induced by incumbent R&D and advertizing • Administrative costs of creating new firms • Labor market regulations We investigate the role of financial constraints as barriers to entry, selection and post-entry growth P.Aghion, T.Fally, S.Scarpetta Conference on Access to Finance, Wordlbank, March 15-16, 2007
In this paper • Effects of financial development on entry by firm size • Effects of financial development on post-entry growth • We use a harmonized firm-level cross country panel data set covering whole population of firms across 16 countries P.Aghion, T.Fally, S.Scarpetta Conference on Access to Finance, Wordlbank, March 15-16, 2007
Main findings • FD has a strong positive impact on entry and post-entry growth of firms • Impact is larger for small firms and may become negative for larger firms • Robust to controlling for entry costs and labor market regulations • Labor market regulations not significantly correlated with post-entry growth P.Aghion, T.Fally, S.Scarpetta Conference on Access to Finance, Wordlbank, March 15-16, 2007
Setup • Two goods (partial equilibrium analysis): • A numeraire that serves as a production and entry input • A consumption good, at price p with a demand D(p) • Each period t, there is a mass 1 of potential entrepreneurs in the consumption good market. An entrepreneur lives two periods. She is characterized by: • Initial capacity T1 (potential number of employees at date t) • Long-term capacity T2(potential number of employees at date t+1) For simplicity, each employee produce one unit and wages equal zero. • There is a large number of investors who can only assess the short-term capacity of potential entrepreneurs P.Aghion, T.Fally, S.Scarpetta Conference on Access to Finance, Wordlbank, March 15-16, 2007
Timing • At time t (short term): • Entrepreneurs decide whether to enter and pay a sunk cost b. They may borrow from investors. • Entrepreneurs that enter produce and sell at equilibrium price p • By investing K units of the numeraire good, entrepreneurs may expand their long-term capacity from T1to (1+αK)T1 • At time t+1 (long term): • Entrepreneurs produce and sell at equilibrium price p • Entrepreneurs repay their debt P.Aghion, T.Fally, S.Scarpetta Conference on Access to Finance, Wordlbank, March 15-16, 2007
Solving the model without capacity expansion • Initial capacity threshold: ex post enforcement requires: L < μpT0whereμ >1 Thus, initial capacity may not be lower than: T*0 = b / μp The initial capacity threshold is decreasing in μp. • Long term capacity threshold: Profits must be higher than sunk entry costs: T = pT0 + δpT1 > b T1 > T*1 = b / δp - T0 / δ The long-term capacity threshold is decreasing with p. • Price equilibrium: D(p) = S(µp, p) D’(p) is decreasingin p and S(µp, p) is increasing in µp and p. P.Aghion, T.Fally, S.Scarpetta Conference on Access to Finance, Wordlbank, March 15-16, 2007
Impact of financial development • Increase the ability to borrow (proportional to μp) Lowers the initial capacity threshold T*0 • Lowers the equilibrium price p: Increases the long-term capacity threshold T*1 • Impact on entry and post-entry growth: • Increases entry by small firms (firms just below the previous short term capacity threshold T*0) • Decreases entry by large firms (firms just above the previous long-term capacity threshold T*1) • Increases post-entry growth because: reduces size at entry & increases growth potentials P.Aghion, T.Fally, S.Scarpetta Conference on Access to Finance, Wordlbank, March 15-16, 2007
Figure 2: Impact on entry of an increase of financial development from µ0 to µ1 P.Aghion, T.Fally, S.Scarpetta Conference on Access to Finance, Wordlbank, March 15-16, 2007
Solving the model with capacity expansion • Higher financial development raises post-entry growth as it increases investment in capacity expansion while again lowering the short-term capacity threshold P.Aghion, T.Fally, S.Scarpetta Conference on Access to Finance, Wordlbank, March 15-16, 2007
Tested predictions • Impact of financial development: • Increase entry by small firms • Decrease entry by large firms • Increase post-entry growth • Even if we control by the size at entry • Partial equilibrium analysis (ignoring economy wide effects through wage and exit options) P.Aghion, T.Fally, S.Scarpetta Conference on Access to Finance, Wordlbank, March 15-16, 2007
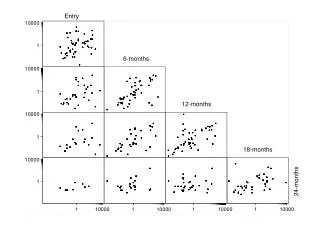
DATA (1) • Coverage : 16 countries (US, Western and Eastern Europe, Latin America) and 30 sectors, during 1990’s. • “Entry” = entry in the database • Reflects real entry of all (1+) firms • Excludes one-year firms • Entry rates are calculated by size categories: s1: 1-19; s2: 20-49; s3: 50-99; s4: 100-499; s5: 500+ • “Post-entry growth”= employment growth of surviving firms • Calculated as employment 6 years after entry among surviving firms compared with employment at entry P.Aghion, T.Fally, S.Scarpetta Conference on Access to Finance, Wordlbank, March 15-16, 2007
DATA (2) • Indicators on financial development (outcome): • Private credit / GDP • Stock market capitalization / GDP • Synthetic index: FD = (credit + stock) / GDP We also consider regulatory variables: • Market: • Investor protection • Public or Private registry (Doing Business 2006, Djankov McLiesh Shleifer 2006) • Bank: • Government ownership • Entry requirements • Regulation of activity • Barriers to foreign entry (Barth Caprio Levine 2003, Micco, Panizza, Yañez 2004, Gwartney, Lawson 2004)
Methodology Difference in difference approach (Rajan Zingales 1998): We test whether financial development has a differential impact in sectors depending on external finance • It allows including a variety of fixed effects (by country and sector) • Other policy variables as controls: • Employment protection legislation (Frazer Institute) Interacted with the intensity of jobflows in US (source: Bartelsman et al. database) • Entry cost (Frazer Institute) Interacted with the turnover rates in US or with the growth potential of the sector (source: STAN, OECD)
Estimated equations • Entry(by country c, industry i, year t and size s): • Post-entry growth(by country c and industry i): P.Aghion, T.Fally, S.Scarpetta Conference on Access to Finance, Wordlbank, March 15-16, 2007
P.Aghion, T.Fally, S.Scarpetta Conference on Access to Finance, Wordlbank, March 15-16, 2007
P.Aghion, T.Fally, S.Scarpetta Conference on Access to Finance, Wordlbank, March 15-16, 2007
P.Aghion, T.Fally, S.Scarpetta Conference on Access to Finance, Wordlbank, March 15-16, 2007
Robustness checks • Sensibility to the set of countries and sectors • Controls for convergence effects (industry share) • Interaction with potential growth (industry growth in US) instead of dependence in external finance • Controls for incumbent size growth • Post-entry growth at different durations • Total employment growth of the cohort P.Aghion, T.Fally, S.Scarpetta Conference on Access to Finance, Wordlbank, March 15-16, 2007
EU countries versus US P.Aghion, T.Fally, S.Scarpetta Conference on Access to Finance, Wordlbank, March 15-16, 2007 Lower competition and higher regulations in EU versus US banking Stock market capitalisation over GDP: 0.64 for EU15 versus 1.17 for US in 2003 Venture capital: 0.5% of GDP in US versus less than 0.15% for Germany, France, Spain, Italy.