Download
1 / 22
220 likes | 338 Views
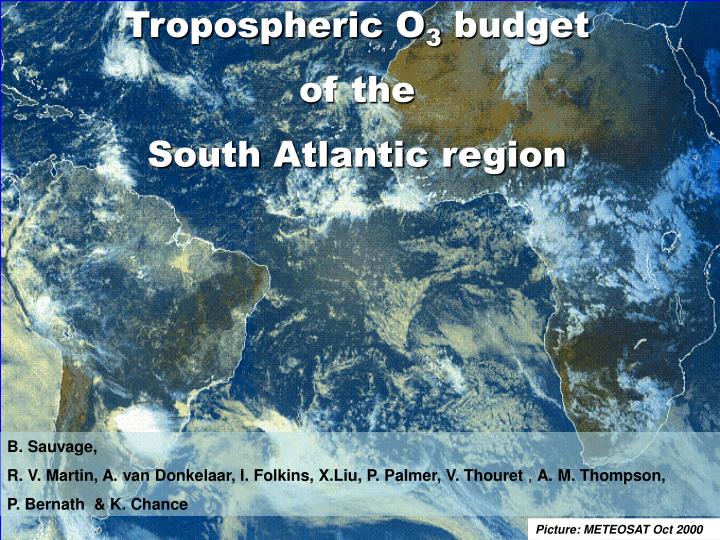
Tropospheric O 3 budget of the South Atlantic region. B. Sauvage, R. V. Martin, A. van Donkelaar, I. Folkins, X.Liu, P. Palmer, V. Thouret , A. M. Thompson, P. Bernath & K. Chance. Picture: METEOSAT Oct 2000. Outstanding scientific issue in the Tropics.

E N D
Tropospheric O3 budget of the South Atlantic region B. Sauvage, R. V. Martin, A. van Donkelaar, I. Folkins, X.Liu, P. Palmer, V. Thouret , A. M. Thompson, P. Bernath & K. Chance Picture: METEOSAT Oct 2000
Outstanding scientific issue in the Tropics Topic: O3 maximum zonal wave-one(from Fishman et al. 1987… to Wang et al 2006) GOME Seasonal Tropospheric O3 Columns 2000 DJF • Scientific interest: • year-round pattern observed since the 80’s. • Situated in MT-UT O3critical for radiative effect • Key role on the oxidizing power of the atmosphere • O3 maximumattributed to various anthropogenic and natural sources + dynamics MAM JJA Goal: What controls O3 maximum? (Sources / regions) SON DU data from Liu et al 2005
Methodology What controls the O3 maximum? 1 Global chemical transport model GEOS-Chem “Original” simulation High estimation emissionsuncertainty 2 Constraint & Evaluation In-situ & satellite observations Soils: a posteriori inventory of NOxfrom GOME (Jaeglé et al., 2005) Biomass burning: top-down constraint on NOx & VOCs from GOME Lightning: spatial distribution scaled to OTD-LIS Quantification (sources / regions) O3 maximum 3 Constrained “standard” simulation
Space-based constraint on emissions Tropospheric NO2 column ~ ENOx Tropospheric HCHO column ~ EVOC GOME: 320x40 km2 OTD-LIS Lightning flash rates hv O3 NO NO2 lifetime ~ month O3,HO2 NOx lifetime ~ week Free Troposphere HNO3 h PBL h NO2 HCHO CO NO OH hours hours O3 O3 VOC HNO3 lifetime ~ days Lifetime hours NOx VOC
Effect of satellite constraint in simulated tropospheric column O3 Large influence from lightning and biomass burning constraint ΔTropospheric O3 Columns “constrained” – “original ”simulations DJF MAM JJA SON ΔDU
Space-based constraint on lightning NOxemissions OTD-LIS flashes (1995-2004) local seasonal rescaling of lightning emissions Modeled lightning NOx emissions (DJF) Original constrained with OTD/LIS 109 molec N cm-2 s-1 -Regional differences / oceanic emissions -Same intensity: 5 Tg N yr-1
In-situ O3, data used to evaluate the simulation 1.MOZAIC airborne program (Marenco et al., 1998; Thouret et al. 1998): 1994-2004 landing and taking off phase 2.SHADOZ ozone sonde network (Thompson et al., 2003a; 2003b): 1998-2004 More than 9000 vertical profiles of O3 over the Tropics 30°N-30°S
Highlights of simulation evaluation: sensitivity to lightning constrained In-situ Rescaling improve middle-upper tropospheric O3 from 5-15 ppbv Main influence over subsident zone; South America; Middle East; East Sensitivity to lightning intensity: 7Tg N/yr too high; 3Tg N/yr too low; 5±2Tg N/yrgives overall agreement.
Space-based constraint on biomass burning emissions GOME NO2regional top-down constraint of biomass burning NOxemissions Tropics: 4.8TgN/yr 5.8TgN/yr GOME Model constrained Model original DJF MAM JJA SON data from Martin et al. 2002 1015 molec cm-2 Better agreement during biomass burning season Better spatial correlations between GOME and model NO2 columns R2 > 0.86
Space-based constraint on biomass burning emissions GOME HCHO top-down constraint of biomass burning VOCemissions HCHO and alkenes emissions increased x 2 GOME GEOS-Chem constrained GEOS-Chem original data from Chance et al. 2000 Better spatial correlations between GOME and model HCHO columns R2> 0.7 Better agreement during biomass burning season
Highlights of simulation evaluation: sensitivity to biomass burning Top-down improves lower tropospheric O3 from 5-20 ppbv during biomass burning season Main influence over Africa DJF-JJA; India MAM
What controls the O3 maximum? Use of constrained simulation Quantify (sources/regions) influencing O3 maximum O3 maximum ?
O3 budget / Sensitivity to sources Sensitivity to decreasing NOx emissions by 1% and 100% for each source >36% >7% >9% DJF MAM JJA SON ΔDU -Lightning downwind;largest influenceover the Tropics & South Atlantic -Surface sources local; half of the lightning NOx influence (but similar source strength) -Lightning Ozone Production Efficiency = 3 times OPE of each surface source -Tropical background 30%
O3 budget Sensitivity to regions Sensitivity to decreasing NOx emissions by 1% over regions >20% >15% >6% DJF MAM JJA SON ΔDU
The zonal-wave one Vertical-zonal seasonal cross section of O3 and O3 flux S. America DJF Africa MAM subsidence JJA SON
Dynamical description / annual mean Meridional transport SHADOZ+ MOZAIC S. Am. Africa NOx ppb 1/Surface emissions of O3 precursors 2/Injection of NOx into the MT-UT with lightning emissions and uplift into ITCZ 3/O3 buildup during transport and subsidence over South Atlantic high area 4/ Meridional transport ATLANTIC AFRICA S N O3 (ppbv) O3 (ppbv) Zonal transport Modeled O3 ppb
Conclusions 1/ Spatial distribution of lightning scaled to reproduce OTD-LIS seasonal mean Improve MT-UT O3 by 5 to 15 ppbv Lightning source of 5 Tg±2Tg best reproducesversusin-situ MOZAIC & SHADOZ 2/ Top-down constraint on emission inventories of NOx from soil and biomass burning, of VOCs from biomass burning improve LT O3 by 5 to 20 ppbv Surface NOx sources > 21% > 36% STE ~ 6% (500 Tg/yr) AFRICA >20% EAST South America >6% >15% O3 maximum is driven by convergence and sustained largely by lightning NOx emissions, which present larger OPE
Thanks for attention! Picture: METEOSAT Oct 2000
Comparison of convective schemes Flight altitude mean over Africa, 300-200hPa, JJA season CO RH ITCZ GEOS-3 presents weak convective outflow GEOS-4 low clouds altitude & optical thickness ITCZ O3 min/ CO max/ RH max Weak incidence over the Atlantic O3 ITCZ
CO & Relative humidity evaluation CO lower estimated in LT / CO; emissions increased by 2 weak or negative impact on modeled versus in-situ
Space-based constraint on emissions Seasonal NOx biomass burning emissions (DJF) Original Standard 109 molec N.cm-2.s-1 Different intensity of NOx emissions: Biomass burning: 4.8TgN/yr 5.8TgN/yr / Soils 3.5TgN/yr 4.5TgN/yr(Tropics). Larger influence over Africa and India.