Download
1 / 3
30 likes | 131 Views
Reaction rates. Exp. 5, Part B. Step 1. Enter data as shown. b.Selected qrea in blue. c. Chart Wizard will generate this graph (I also used a trendline for each set of points ). Step 2. a. Pick two points on the 0.5mM line. b. Record the x and y values for each point. Y2, X2.

E N D
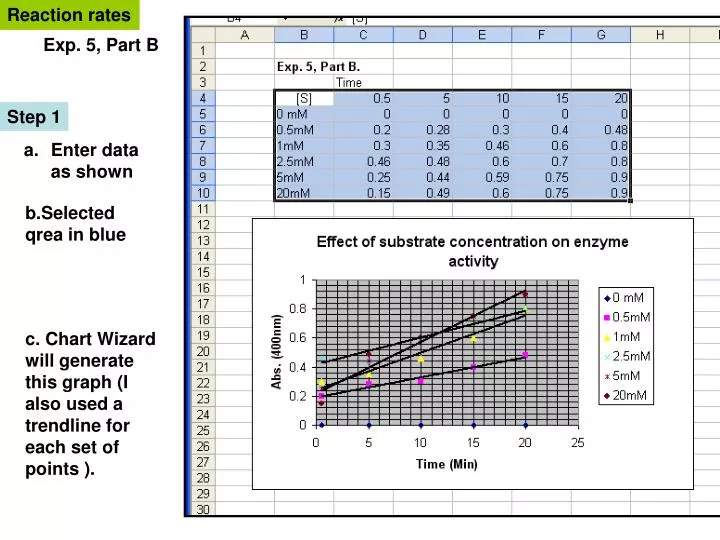
Reaction rates Exp. 5, Part B Step 1 • Enter data as shown b.Selected qrea in blue c. Chart Wizard will generate this graph (I also used a trendline for each set of points ).
Step 2 a. Pick two points on the 0.5mM line b. Record the x and y values for each point Y2, X2 Here, X2= 15 min X1= 5 min Y2= 0.4 units Y1= 0.23 units Y1, X1 I chose these two points c. Calculate slope of line = (Y2 – Y1)/ X2 –X1) =(0.4-0.23)/ 15-5) =0.17/10min or 0.017units/min d. Now do the same to calculate the slope for every other line.
Step 3 a. Enter slope of each line on a table In Chart Wizard, highlight blue area and select XY scatter and this style to make a graph. Note that the rate for 2.5 mM substrate is unexpected . Even so, conclusions can be made about the overall effect of substrate concentration on reaction rates.