Download
1 / 12
120 likes | 243 Views
Rocky Mountain National Park. National Park Service Mission

E N D
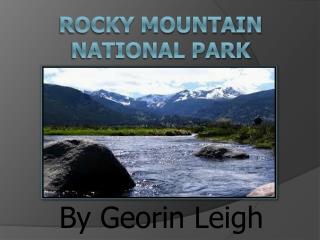
Rocky Mountain National Park National Park Service Mission The National Park Service preserves unimpaired the natural and cultural resources and values of the national park system for the enjoyment, education and inspiration of this and future generations. The Park Service cooperates with partners to extend the benefits of natural and cultural resource conservation and outdoor recreation throughout this country and the world.
Rocky Mountain National Park Rocky Mountain National Park Organic Act Rocky Mountain National Park was created in 1915 when Congress stated: “said area is dedicated and set apart as a public park for the benefit and enjoyment of people of the United States and with regulations being primarily aimed at the freest use of the said park for recreational purposes by the public and for the preservation of the natural conditions and scenic beauties thereof."
Rocky Mountain National Park Legislative History 1915 Act that established Rocky Mountain National Park 1916 Organic Act establishing the National Park Service 1964 Wilderness Act leading to 1974 proposed wilderness and 2009 designated wilderness 1976 recognized as an International Biosphere Reserve 1977 Clean Air Act amendment. Class 1 air quality area (cleanest air designation)
Rocky Mountain National Park: Continuum of Impacts to Ecological Health Rocky Mountain National Park: Continuum of Impacts to Ecological Health Current N deposition in Rocky Mountain NP N Load (kg/ ha /yr)- wet 3.1 kg/ha/yr Aquatic Ecosystem Critical Load 1.5 kg/ha/yr “weight of evidence” of ecosystem health decline on east side of park Natural background N deposition 0.2 kg/ha/yr Effects on aquatic animals (episodic acidification) Forest decline (acidification effects on trees) Changes in soil & water chemistry Surface water N saturation Changes in tree chemistry Change in aquatic plant species composition Change in alpine plant species Lethal effects on fish, other aquatic animals (chronic acidification)
Rocky Mountain National Park: Continuum of Impacts to Ecological Health Model predicts by year 2088 14.0 *Modeled projections at current rates of N deposition increase (2.5%/year) (Sullivan et al 2005; Hartman) Model predicts by year 2028 7.1 (Sullivan et al 2005; Hartman) N Load (kg/ha/yr) 4.0 Current N deposition in RMNP (Bowman, Ecological Applications) (Rueth and Baron 2002) (Burns 2004; Baron and Campbell 1997; Campbell et al 2000) 1.5 Hindcast ~1950 (Wolff et al 2003; Baron, Ecological Applications) 0.2 Natural background N deposition (Galloway et al 1982; Galloway et al 1995; Hedin et al 1995; NPS 2002) * Hartman’s model runs used for time to acidification, Sullivan’s deposition load estimates very similar to Hartman’s but slightly higher Change in aquatic plant species composition Surface water N saturation Changes in soil and tree chemistry Change in alpine plant species Effects on fish, other aquatic animals (episodic acidification) Lethal effects on fish, other aquatic animals (chronic acidification) Thresholds of unnatural ecosystem change are defined for specific indicators and endpoints
Rocky Mountain National Park: Continuum of Impacts to Ecological Health Model predicts by year 2088 14.0 *Modeled projections at current rates of N deposition increase (2.5%/year) (Sullivan et al 2005; Hartman) Model predicts by year 2028 7.1 (Sullivan et al 2005; Hartman) N Load (kg/ha/yr) 4.0 Current N deposition in RMNP (Bowman, Ecological Applications) (Rueth and Baron 2002) (Burns 2004; Baron and Campbell 1997; Campbell et al 2000) 1.5 Hindcast ~1950 (Wolff et al 2003; Baron, Ecological Applications) 0.2 Natural background N deposition (Galloway et al 1982; Galloway et al 1995; Hedin et al 1995; NPS 2002) * Hartman’s model runs used for time to acidification, Sullivan’s deposition load estimates very similar to Hartman’s but slightly higher Change in aquatic plant species composition Surface water N saturation Changes in soil and tree chemistry Change in alpine plant species Effects on fish, other aquatic animals (episodic acidification) Lethal effects on fish, other aquatic animals (chronic acidification) Thresholds of unnatural ecosystem change are defined for specific indicators and endpoints
Rocky Mountain National Park What is the park doing to reduce its own emissions? Rocky Mountain National Park Energy Sustainability and Green House Gas Emissions Climate Friendly Park with a commitment to reduce green house gas emissions by 17 percent below the 2005 level of 3,540 metric tons by 2017. Using American Reinvestment Recovery Act is changing the park's fleet by replacing up to 57 of the parks 141 low efficiency park vehicles with higher efficiency vehicles. Shuttle system was expansion in 2005 and again in 2008 to add/connect the Town of Estes Park to the park's "hiker shuttle" and the Alpine Visitor Center tour. Shuttle expansion reduced the vehicle miles travelled in the park. In 2007 the RMNP Green Team was formed. The team provides an interdisciplinary approach to assist in implementing sustainable practices, promoting environmentally responsible behavior, and to help the park serve as a role model for environmental stewardship. The park is working design and fund energy efficiency and renewable energy projects in the park – in partnership with CSU and the National Renewable Energy Laboratory DoYourPartParks.org and messaging in various venues (including podcasts, park newspaper, and shuttle buses) continues to inform park visitors and staff about ways they can minimize impacts to their RMNP Climate Friendly Park. RMNP partnership with Larimer County has converted the park's recycling system to single-stream recycling, allowing for more materials to be recycled. Multiple efficiencies to park facilities including: tankless "on demand" hot water heaters, solar lighting tubes, energy efficient lighting, recycled asphalt used on park roads projects, energy efficient generators at Alpine Visitor Center, the Green Rehabilitation of the park's employee laundry facility. Park Reduces Energy Consumption during 2009 ELECTRICITY: During FY09, the park used 257,298 KWH less this year than in FY 08, a 10 percent reduction. NATURAL GAS: During FY09 the park used 4,729 therms less than in FY 08 a 5.6 percent reduction.