Download
1 / 1
10 likes | 90 Views
a). b). c). d). a). b). a). b). a). b). The ENSO signal impact in the rainfall of the Southwestern Europe before and after the Climate Shift. I. Iglesias (1), M.N. Lorenzo (1), B. Rodríguez-Fonseca (2), J.J. Taboada (3), M. Gómez-Gesteira (1), and F.Santos (1)

E N D
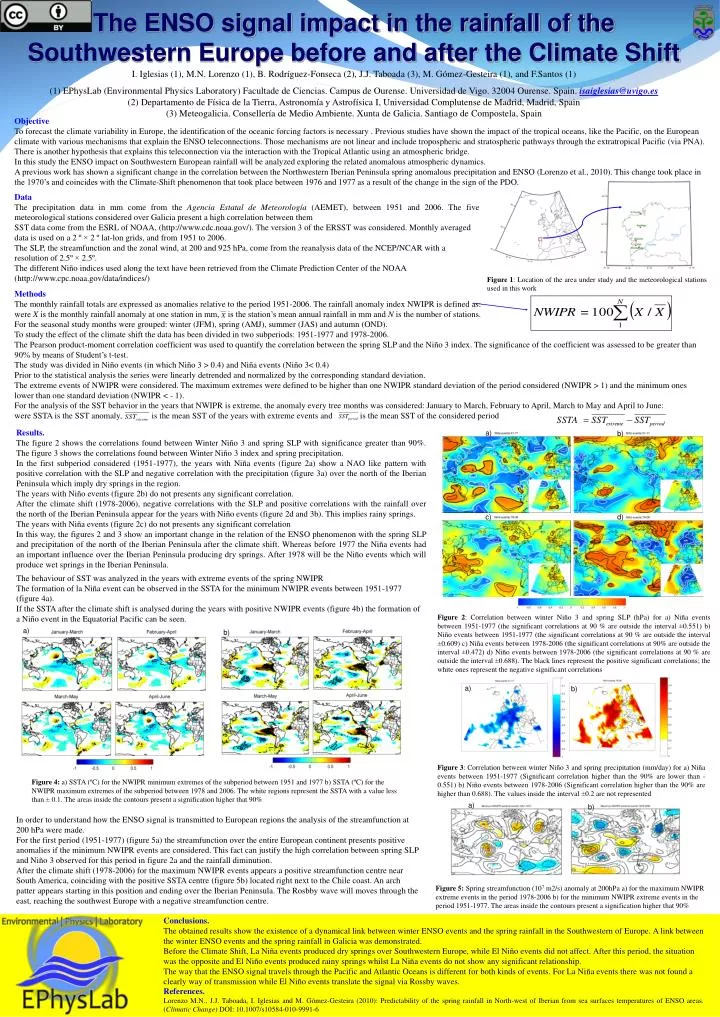
a) b) c) d) a) b) a) b) a) b) The ENSO signal impact in the rainfall of the Southwestern Europe before and after the Climate Shift I. Iglesias (1), M.N. Lorenzo (1), B. Rodríguez-Fonseca (2), J.J. Taboada (3), M. Gómez-Gesteira (1), and F.Santos (1) (1) EPhysLab (Environmental Physics Laboratory) Facultade de Ciencias. Campus de Ourense. Universidad de Vigo. 32004 Ourense. Spain. isaiglesias@uvigo.es (2) Departamento de Física de la Tierra, Astronomía y Astrofísica I, Universidad Complutense de Madrid, Madrid, Spain (3) Meteogalicia. Consellería de Medio Ambiente. Xunta de Galicia. Santiago de Compostela, Spain Objective To forecast the climate variability in Europe, the identification of the oceanic forcing factors is necessary . Previous studies have shown the impact of the tropical oceans, like the Pacific, on the European climate with various mechanisms that explain the ENSO teleconnections. Those mechanisms are not linear and include tropospheric and stratospheric pathways through the extratropical Pacific (via PNA). There is another hypothesis that explains this teleconnection via the interaction with the Tropical Atlantic using an atmospheric bridge. In this study the ENSO impact on Southwestern European rainfall will be analyzed exploring the related anomalous atmospheric dynamics. A previous work has shown a significant change in the correlation between the Northwestern Iberian Peninsula spring anomalous precipitation and ENSO (Lorenzo et al., 2010). This change took place in the 1970’s and coincides with the Climate-Shift phenomenon that took place between 1976 and 1977 as a result of the change in the sign of the PDO. Data The precipitation data in mm come from the Agencia Estatal de Meteorología (AEMET), between 1951 and 2006. The five meteorological stations considered over Galicia present a high correlation between them SST data come from the ESRL of NOAA, (http://www.cdc.noaa.gov/). The version 3 of the ERSST was considered. Monthly averaged data is used on a 2 º × 2 º lat-lon grids, and from 1951 to 2006. The SLP, the streamfunction and the zonal wind, at 200 and 925 hPa, come from the reanalysis data of the NCEP/NCAR with a resolution of 2.5º × 2.5º. The different Niño indices used along the text have been retrieved from the Climate Prediction Center of the NOAA (http://www.cpc.noaa.gov/data/indices/) Figure 1:Location of the area under study and the meteorological stations used in this work Methods The monthly rainfall totals are expressed as anomalies relative to the period 1951-2006. The rainfall anomaly index NWIPR is defined as: were X is the monthly rainfall anomaly at one station in mm, is the station’s mean annual rainfall in mm and N is the number of stations. For the seasonal study months were grouped: winter (JFM), spring (AMJ), summer (JAS) and autumn (OND). To study the effect of the climate shift the data has been divided in two subperiods: 1951-1977 and 1978-2006. The Pearson product-moment correlation coefficient was used to quantify the correlation between the spring SLP and the Niño 3 index. The significance of the coefficient was assessed to be greater than 90% by means of Student’s t-test. The study was divided in Niño events (in which Niño 3 > 0.4) and Niña events (Niño 3< 0.4) Prior to the statistical analysis the series were linearly detrended and normalized by the corresponding standard deviation. The extreme events of NWIPR were considered. The maximum extremes were defined to be higher than one NWIPR standard deviation of the period considered (NWIPR > 1) and the minimum ones lower than one standard deviation (NWIPR < - 1). For the analysis of the SST behavior in the years that NWIPR is extreme, the anomaly every tree months was considered: January to March, February to April, March to May and April to June: were SSTA is the SST anomaly, is the mean SST of the years with extreme events and is the mean SST of the considered period Results. The figure 2 shows the correlations found between Winter Niño 3 and spring SLP with significance greater than 90%. The figure 3 shows the correlations found between Winter Niño 3 index and spring precipitation. In the first subperiod considered (1951-1977), the years with Niña events (figure 2a) show a NAO like pattern with positive correlation with the SLP and negative correlation with the precipitation (figure 3a) over the north of the Iberian Peninsula which imply dry springs in the region. The years with Niño events (figure 2b) do not presents any significant correlation. After the climate shift (1978-2006), negative correlations with the SLP and positive correlations with the rainfall over the north of the Iberian Peninsula appear for the years with Niño events (figure 2d and 3b). This implies rainy springs. The years with Niña events (figure 2c) do not presents any significant correlation In this way, the figures 2 and 3 show an important change in the relation of the ENSO phenomenon with the spring SLP and precipitation of the north of the Iberian Peninsula after the climate shift. Whereas before 1977 the Niña events had an important influence over the Iberian Peninsula producing dry springs. After 1978 will be the Niño events which will produce wet springs in the Iberian Peninsula. The behaviour of SST was analyzed in the years with extreme events of the spring NWIPR The formation of la Niña event can be observed in the SSTA for the minimum NWIPR events between 1951-1977 (figure 4a). If the SSTA after the climate shift is analysed during the years with positive NWIPR events (figure 4b) the formation of a Niño event in the Equatorial Pacific can be seen. Figure 2:Correlation between winter Niño 3 and spring SLP (hPa) for a) Niña events between 1951-1977 (the significant correlations at 90 % are outside the interval ±0.551) b) Niño events between 1951-1977 (the significant correlations at 90 % are outside the interval ±0.609) c) Niña events between 1978-2006 (the significant correlations at 90% are outside the interval ±0.472) d) Niño events between 1978-2006 (the significant correlations at 90 % are outside the interval ±0.688). The black lines represent the positive significant correlations; the white ones represent the negative significant correlations Figure 3:Correlation between winter Niño 3 and spring precipitation (mm/day) for a) Niña events between 1951-1977 (Significant correlation higher than the 90% are lower than -0.551) b) Niño events between 1978-2006 (Significant correlation higher than the 90% are higher than 0.688). The values inside the interval ±0.2 are not represented Figure 4: a) SSTA (ºC) for the NWIPR minimum extremes of the subperiod between 1951 and 1977 b) SSTA (ºC) for the NWIPR maximum extremes of the subperiod between 1978 and 2006. The white regions represent the SSTA with a value less than ± 0.1. The areas inside the contours present a signification higher that 90% a) a) b) b) In order to understand how the ENSO signal is transmitted to European regions the analysis of the streamfunction at 200 hPa were made. For the first period (1951-1977) (figure 5a) the streamfunction over the entire European continent presents positive anomalies if the minimum NWIPR events are considered. This fact can justify the high correlation between spring SLP and Niño 3 observed for this period in figure 2a and the rainfall diminution. After the climate shift (1978-2006) for the maximum NWIPR events appears a positive streamfunction centre near South America, coinciding with the positive SSTA centre (figure 5b) located right next to the Chile coast. An arch patter appears starting in this position and ending over the Iberian Peninsula. The Rosbby wave will moves through the east, reaching the southwest Europe with a negative streamfunction centre. Figure 5: Spring streamfunction (107 m2/s) anomaly at 200hPa a) for the maximum NWIPR extreme events in the period 1978-2006 b) for the minimum NWIPR extreme events in the period 1951-1977. The areas inside the contours present a signification higher that 90% Conclusions. The obtained results show the existence of a dynamical link between winter ENSO events and the spring rainfall in the Southwestern of Europe. A link between the winter ENSO events and the spring rainfall in Galicia was demonstrated. Before the Climate Shift, La Niña events produced dry springs over Southwestern Europe, while El Niño events did not affect. After this period, the situation was the opposite and El Niño events produced rainy springs whilst La Niña events do not show any significant relationship. The way that the ENSO signal travels through the Pacific and Atlantic Oceans is different for both kinds of events. For La Niña events there was not found a clearly way of transmission while El Niño events translate the signal via Rossby waves. References. Lorenzo M.N., J.J. Taboada, I. Iglesias and M. Gómez-Gesteira (2010): Predictability of the spring rainfall in North-west of Iberian from sea surfaces temperatures of ENSO areas. (Climatic Change) DOI: 10.1007/s10584-010-9991-6