Download
1 / 10
100 likes | 300 Views
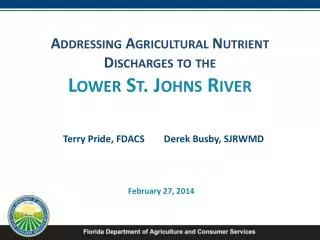
Lower St. Johns River Main Stem BMAP Five Year Assessment Report. Executive Committee Meeting February 27, 2014. 5 Year Assessment Report Overview. This is the fifth annual report on the basin management action plan (BMAP) activities.

E N D
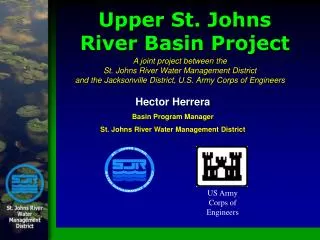
Lower St. Johns River Main Stem BMAP Five Year Assessment Report Executive Committee Meeting February 27, 2014
5 Year Assessment Report Overview • This is the fifthannual report on the basin management action plan (BMAP) activities. • Information was provided by the stakeholders on activities from January 1, 2013 through December 31, 2013. • The report includes: • Major accomplishments; • Major issues; • Upcoming year activities; and • Water quality trends.
Freshwater Section Reductions Table 12: Progress Towards the TP TMDL in the Freshwater Reach Table 13: Progress Towards the TN TMDL in the Freshwater Reach
Freshwater Progress Towards the TMDLs TP TMDL TN TMDL 95% achieved; 5% of reductions remaining. 94% achieved; 6% of reductions remaining.
Marine Section Reductions Table 14: Progress Towards the TN TMDL in the Marine Reach * The WWTFs in the marine section have exceeded the necessary reductions overall; however, several projects are still ongoing that are required for individual stakeholders to achieve their portion of the reductions.
Marine Section Progress Towards the TN TMDL 94% achieved; 6% of reductions remaining.
Data represent discharge monthly reports (DMRs) submitted in November 2013.
Data represent discharge monthly reports (DMRs) submitted in November 2013.
Scheduled Efforts in 2014 • Clay County—Wet detention pond construction. • City of Palatka—First flush treatment project. • City of Jacksonville—Continue septic tank phase out, stormwater projects, and trading efforts . • Agriculture—BMP implementation, Tri-County Agricultural Area (TCAA) Water Management Partnership, and BMP compliance process. • On-going activities by many entities.