Download
1 / 1
10 likes | 223 Views
Maximizing the Statistical Assessment of Antibody Titer Data: The Proportional Odds Model. Table 1 – Proportional odds assumption. Continuation of Power Calculations. Continuation of Power Calculations. Abstract. Table 2 – Results. Acknowledgements. Power Calculations. Introduction.

E N D
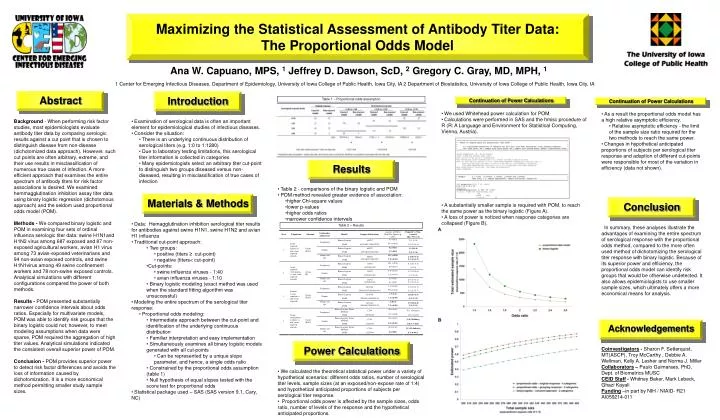
Maximizing the Statistical Assessment of Antibody Titer Data: The Proportional Odds Model Table 1 – Proportional odds assumption Continuation of Power Calculations Continuation of Power Calculations Abstract Table 2 – Results Acknowledgements Power Calculations Introduction Conclusion Results Materials & Methods Ana W. Capuano, MPS, 1 Jeffrey D. Dawson, ScD, 2 Gregory C. Gray, MD, MPH, 1 1 Center for Emerging Infectious Diseases, Department of Epidemiology, University of Iowa College of Public Health, Iowa City, IA 2 Department of Biostatistics, University of Iowa College of Public Health, Iowa City, IA • We used Whitehead power calculation for POM. • Calculations were performed in SAS and the hmisc procedure of R (R: A Language and Environment for Statistical Computing, Vienna, Austria). • As a result the proportional odds model has a high relative asymptotic efficiency. • Relative asymptotic efficiency - the limit of the sample size ratio required for the two methods to reach the same power. • Changes in hypothetical anticipated proportions of subjects per serological titer response and adoption of different cut-points were responsible for most of the variation in efficiency (data not shown). Background - When performing risk factor studies, most epidemiologists evaluate antibody titer data by comparing serologic results against a cut point that is chosen to distinguish disease from non-disease (dichotomized data approach). However, such cut points are often arbitrary, extreme, and their use results in misclassification of numerous true cases of infection. A more efficient approach that examines the entire spectrum of antibody titers for risk factor associations is desired. We examined hemmagglutination inhibition assay titer data using binary logistic regression (dichotomous approach) and the seldom used proportional odds model (POM). Methods - We compared binary logistic and POM in examining four sets of ordinal influenza serologic titer data: swine H1N1and H1N2 virus among 687 exposed and 87 non-exposed agricultural workers, avian H1 virus among 73 avian-exposed veterinarians and 94 non-avian exposed controls, and swine H1N1virus among 49 swine confinement workers and 78 non-swine exposed controls. Analytical simulations with different configurations compared the power of both methods. Results - POM presented substantially narrower confidence intervals about odds ratios. Especially for multivariate models, POM was able to identify risk groups that the binary logistic could not; however, to meet modeling assumptions when data were sparse, POM required the aggregation of high titer values. Analytical simulations indicated the consistent overall superior power of POM. Conclusion - POM provides superior power to detect risk factor differences and avoids the loss of information caused by dichotomization. It is a more economical method permitting smaller study sample sizes. • Examination of serological data is often an important element for epidemiological studies of infectious diseases. • Consider the situation: • There is an underlying continuous distribution of serological titers (e.g. 1:0 to 1:1280) • Due to laboratory testing limitations, this serological titer information is collected in categories • Many epidemiologists select an arbitrary titer cut-point to distinguish two groups diseased versus non-diseased, resulting in misclassification of true cases of infection • Table 2 - comparisons of the binary logistic and POM • POM method revealed greater evidence of association: • higher Chi-square values • lower p-values • higher odds ratios • narrower confidence intervals • A substantially smaller sample is required with POM, to reach the same power as the binary logistic (Figure A). • A loss of power is noticed when response categories are collapsed (Figure B). • Data: Hemagglutination inhibition serological titer results for antibodies against swine H1N1, swine H1N2 and avian H1 influenza • Traditional cut-point approach: • Two groups: • positive (titers ≥ cut-point) • negative (titers< cut-point) • Cut-points: • swine influenza viruses - 1:40 • avian influenza viruses - 1:10 • Binary logistic modeling (exact method was used when the standard fitting algorithm was unsuccessful) • Modeling the entire spectrum of the serological titer response: • Proportional odds modeling: • Intermediate approach between the cut-point and identification of the underlying continuous distribution • Familiar interpretation and easy implementation • Simultaneously examines all binary logistic models generated with all cut-points • Can be represented by a unique slope parameter, and hence, a single odds ratio • Constrained by the proportional odds assumption (table 1) • Null hypothesis of equal slopes tested with the score test for proportional odds • Statistical package used – SAS (SAS version 9.1, Cary, NC) In summary, these analyses illustrate the advantages of examining the entire spectrum of serological response with the proportional odds method, compared to the more often used method of dichotomizing the serological titer response with binary logistic. Because of its superior power and efficiency, the proportional odds model can identify risk groups that would be otherwise undetected. It also allows epidemiologists to use smaller sample sizes, which ultimately offers a more economical means for analysis. Coinvestigators - Sharon F. Setterquist, MT(ASCP), Troy McCarthy , Debbie A. Wellman, Kelly A. Lesher and Norma J. Miller Collaborators – Paulo Guimaraes, PhD, Dept. of Biometrics MUSC CEID Staff - Whitney Baker, Mark Lebeck, Ghazi Kayali Funding –in part by NIH / NIAID- R21 AI059214-011 • We calculated the theoretical statistical power under a variety of hypothetical scenarios: different odds ratios, number of serological titer levels, sample sizes (at an exposed/non-expose rate of 1:4) and hypothetical anticipated proportions of subjects per serological titer response. • Proportional odds power is affected by the sample sizes, odds ratio, number of levels of the response and the hypothetical anticipated proportions.