Download
1 / 25
260 likes | 266 Views
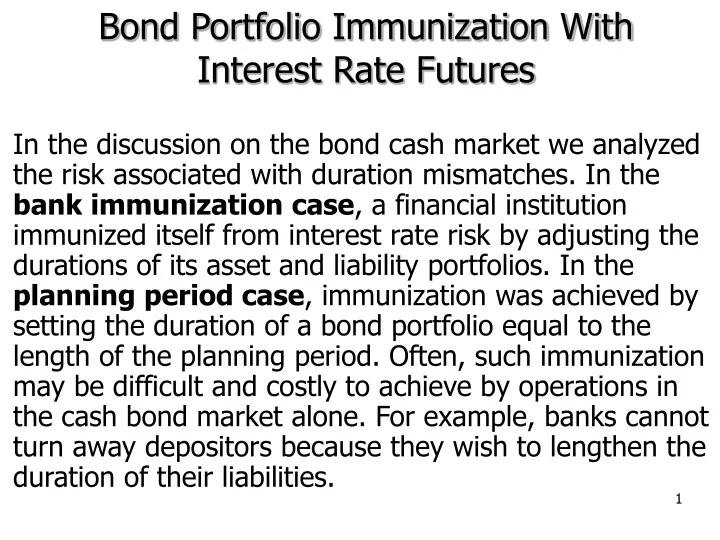
Bond Portfolio Immunization With Interest Rate Futures.

E N D
Bond Portfolio Immunization With Interest Rate Futures In the discussion on the bond cash market we analyzed the risk associated with duration mismatches. In the bank immunization case, a financial institution immunized itself from interest rate risk by adjusting the durations of its asset and liability portfolios. In the planning period case, immunization was achieved by setting the duration of a bond portfolio equal to the length of the planning period. Often, such immunization may be difficult and costly to achieve by operations in the cash bond market alone. For example, banks cannot turn away depositors because they wish to lengthen the duration of their liabilities.
With the development of interest rate futures markets over the past 30 years, financial managers have a valuable tool to use in bond portfolio immunization strategies. Two examples of immunization with interest rate futures, one for the planning period case and one for the bank immunization case, are presented here. Table A presents data on the bonds used in the examples, along with data for T-bill and T-bond futures contracts. The table reflects the assumption of a flat yield curve and instruments of the same risk level.
Coupon Maturity Yield Price Duration A $1,000 8% 4 yrs. 12% $885.59 3.475 B $1,000 10% 10 yrs. 12% $903.47 6.265 C $1,000 4% 15 yrs. 12% $463.05 9.285 T-Bond Futures $100,000 8% 20 yrs. 12% $71,875 8.674 T-Bill Futures $1,000,000 ¼ yr. 12% $972,070 .25 Table A: Instruments for the Immunization Analysis Bond FV
The 6-year Planning Period Case Consider a $100 million invested in Bond C. This portfolio’s duration is 9.285 years.The portfolio manager wants to shorten the portfolio duration to 6 years in order to match a 6-year planning period. In this case, the decision is to sell some of Bond C and buy some of Bond A. Mathematically, the conditions are: where W is the percentage of portfolio funds invested in the corresponding asset . The solution is: put 56.54% of the $100 million in Bond A, and 43.46% in bond C. Call this Portfolio1 – using the cash market only.
The 6-year Planning Period Case Alternatively, the portfolio’s duration may be adjusted to match the six-year planning period by trading interest rate futures. In Portfolio 2, the manager keeps the original portfolio of $100,000,000 in Bond C and trades T-bill futures to adjust the duration of the combined portfolio of Bond C and futures.
The 6-year Planning Period Case Portfolio 2:Bond C and T-bill futures. Let VP = value of the portfolio Pi = price of Bond i; i=A,B,C Ni= number of Bond i; i=A,B,C FT-bill= T-bill futures price NT-bill= number of T-bills contracts FT-bond= T-bond futures price NT-bond= number of T-bond contracts Notice that VP = PCNC = $100,000,000. This is so, because the futures require no initial investment. The planning period is 6 years, thus:
How many T-bill contracts? Solving for NT-bill we obtain:
The same technique used to create Portfolio 2 can be applied using a T-bond futures contract, giving rise to Portfolio 3. Solving:
The 6-year Planning Period Case How many T-bond contracts? Solving for NT-bond we obtain:
Portfolio 1 Bonds Only Portfolio 2 Bonds and Futures Portfolio 3 Bonds and Futures Portfolio WA 56.54% 0 0 Weights WC 43.43% 1.0 1.0 WT-bill 0 -13.14 0 WT-bond 0 0 -.378718 Number of NC 93,856 215,959 0 215,959 Instruments NA 63,844 0 NT-bill 0 - 1,352contracts short 0 Value NT-bond 0 0 - 527contracts shorts of Each NCPC $43,460,021 $100,000,000 0 $100,000,000 Instrument NAPA $56,539,608 0 NT-billFT-bill 0 $1,314,238,640 short 0 NT-bondFT-bond 0 0 $37,878,125 short Portfolio Value $100,000,000 $100,000,000 $100,000,000 Table B Portfolio Characteristics for the 6-year Planning Period Case
To see how these three immunized portfolios perform, assume: 1. Interest rate falls from 12% to 11% for all maturities. 2. All coupon receipts during the six-year planning period can be reinvested at 11% until the end of the planning period. With the shift in interest rates the new prices are: PA= $913.57; PC= $504.33; FT-bill = $974,250; FT-bond= $77,813.
The 6-year Planning Period Case Table C below, shows the effect of the interest rate shift on portfolio values, the terminal wealth at the 6-year planning period end and on the total wealth position of the portfolio holder. As the Table reveals, each portfolio responds similarly to the shift in yields. The table demonstrates that the annualized holding period rate of return on every one of the three Portfolios remains 12%. The slight differences are due to either rounding errors or the fact that the duration price change formula holds exactly only for infinitesimal changes in yields.
Portfolio 1 Portfolio 2 Portfolio 3 Initial Portfolio Value $100,000,000 $100,000,000 $100,000,000 New Portfolio Value $105,660,731 $108,914,787 $108,914,787 Gain/ Loss on Futures 0 <$2,946,808> <$3,128,792> Total Wealth Change $5,660,731 $5,967,979 $5,785,995 Terminal Value of all Funds at n = 6 $197,629,369 $198,204,050 $197,868,664 Annualized Holding Period Return over 6 Years 1.12 1.12 1.12 Source: From R. Kolb and G. Gay, “ Immunizing Bond Portfolios with Interest Rate Futures,” Financial Management, Summer 1982, pp. 81-89. Reprinted by permission of Financial Management Association, University of South Florida, College of Business, Tampa, FL 33620 (813) 974-2084 Table C: The Effect of a 1% Drop in Yields on realized Portfolio Returns
The 6-year Planning Period Case One important concern in the implementation of immunization strategies is the cost involved. In immunizing, commission charges, marketability, and liquidity of the instruments involved become increasingly important. These considerations highlight the practical usefulness of interest rate futures in bond portfolio management. We now analyze the cost of the 6-year planning period case.
The 6-year Planning period Case Let us analyze the cost of implementing the 6-year planning period case. The transaction costs associated with the different portfolios for the 6-year planning period case, starting from the initial position of $100,000,000 in Bond C, and shortening the duration to six years. Table F shows the trades necessary and the estimated costs involved. Assume: Commission fee for bond trading: $5/bond Cost of trading futures contracts: $20/contract
Portfolio 1 Portfolio 2 Portfolio 3 NA Long 63,844 - - NC Short 122,103 - - NT-bill - Short 1,352 - NT-bond - - Short 527 One Way Transaction Cost Bond A @ $5/bond $319,220 - - Bond C @ $5/bond $610,515 - - T-Bill Futures $20/contract - $27,040 - T-Bond Futures $20/contract - - $10,540 Total Cost of Implementation $929,735 $27,040 $10,540 Table F: Transaction Costs for the 6-year Planning Period Case
The 6-year Planning Period Case To implement Portfolio 1, one must sell 122,103 bonds of type C and buy 63,844 bonds of type A. Assuming a commission charge of $5 per bond, the total commission is $929,735. By contrast one could short 1,352 T-bill futures contracts to implement Portfolio 2, at total cost of $27,040. Alternatively, Portfolio 3 implies a short of 527 T-bond futures at a total cost of $10,540. In addition, margin deposits of approximately $2,000,000 for Portfolio 2 or, $800,000 for Portfolio 3 are required. Of course, margin deposits may be in the form of interest earning assets.
The 6-year Planning Period Case Clearly, there is a tremendous difference in transaction costs between trading the bonds in the cash market and futures contracts. The cost of shorting the 1,352 T-bill futures is a small percentage of the daily volume or recent open interest. Likewise, the 527 T-bond futures constitute only a trivial fraction of the volume and open interest in that market. The evident ability of the futures market to absorb the kind of activity involved in this example demonstrates the practical usefulness rate futures in managing bond portfolios. Notice, however, that the futures will have to be rolled over when their delivery month arrives. This roll-over presents some risk associated with these strategies.
The Bank Immunization Case We now, turn to the example of the bank immunization case. Assume that a bank holds a $100,000,000 liability portfolio in Bond B. The bank wishes to protect it’s wealth position from any change which might ensue a change in yields. Five different portfolio combinations illustrate different means to achieve the desired result: ASSETSLIABILITY Portfolio 1: Bond A and Bond C. Bond B. Portfolio 2: Bond C; sell T-bill futures. Bond B. Portfolio 3: Bond A; buy T-bond future Bond B. Portfolio 4: Bond A; buy T-bill futures. Bond B. Portfolio 5: Bond C; sell T-bond futures. Bond B.
The Bank Immunization Case For each portfolio in Table D, the full $100,000,000 is put in a bond portfolio and is balanced out by cash. Portfolio 1 exemplifies the traditional approach of immunizing by holding only bonds. Portfolio 2 and Portfolio 5 are composed of Bond C and a short futures position. By contrast, the low volatility Bond A is held in Portfolio 3 and Portfolio 4. In conjunction with Bond A, the overall interest rate sensitivity is increased by buying interest rate futures.
Liability Portfolio 1 Portfolio 2 Portfolio 3 Portfolio 4 Portfolio 5 Portfolio (Bonds only) (Short T-Bill (Long T-Bond (Long T-Bill (Short T-Bond) Futures) Futures) Futures) Futures) Portfolio WA 0 51.98% 0 100% 100% 0 Weights WB 100% 0 0 0 0 0 WC 0 48.02% 100% 0 0 100% WCash ~0 ~0 ~0 ~0 ~0 ~0 Number of NA 0 58,695 0 112,919 112,919 0 Instruments NB 110,684 0 0 0 0 0 NC 0 103,704 215,959 0 0 215,959 NT-Bill 0 0 <1,242,710> 0 1,148,058 0 NT-Bond 0 0 0 44,751 0 <48,441> NAPA 0 51,979,705 0 99,999,937 99,999,937 0 NBPB 99,999,673 0 0 0 0 0 NCPC 0 48,020,137 999,999,815 0 0 99.999,815 Cash 327 158 185 63 63 185 NT-BillFT-Bill 0 0 <1,208,001,110> 0 1,115,992,740 0 NT-BondFT-Bond 0 0 0 32,164,781 0 <34,816,969> Portfolio Value 100,000,000 100,000,000 100,000,000 100,000,000 100,000,000 100,000,000 Table 8.28: Liability Portfolio and Five Alternative Immunizing Portfolios
The Bank Immunization Case Is the banks wealth immunized against market yield change? To answer this question, assume an instantaneous drop in rates from 12% to 11% for all maturities. Table E shows the effect of the 1% drop on the portfolios. As the rows reporting wealth change reveal, all five portfolios perform similarly. The small differences stem from rounding errors and the discrete change in interest rates. Table E below, demonstrates that all five portfolios may serve to immunize the bank’s wealth. For all five portfolios, the wealth change which ensues a yield change is virtually zero.
Liability Portfolio 1 Portfolio 2 Portfolio 3 Portfolio 4 Portfolio 5 Initial Portfolio Value 100,000,000 100,000,000 100,000,000 100,000,000 100,000,000 100,000,000 New Portfolio Value 105,910,526 105,923,188 108,914,788 103,159,474 103,159,474 108,914,788 Profit on Futures 0 - <2,709,108> 2,657,314 2,502,766 <2,876,427> Total Wealth Change: Bonds + Futures. 5,910,526 5,923,188 6,205,680 5,816,788 5,662,240 6,038,361 Total Wealth change: Asset-Liability Portfolio. - 12,622 295,154 <93,738> <248,286> 127,835 % of Wealth Change - .00013 .00295 <.00094> <.00248> .00128 Source: From R. Kolb and G. Gay, “ Immunizing Bond Portfolios with Interest Rate Futures,” Financial Management, Summer 1982, pp. 81-89. Reprinted by permission of Financial Management Association, University of South Florida, College of Business, Tampa, FL 33620 (813) 974-2084 Table E: The Effect of a 1% Drop in Yields on Total Wealth
Conclusion: Until recently, immunization strategies for bond portfolios have traditionally focused on all bond portfolios. The analyses of the 6-year Planning Period case and The Bank Immunization case have shown that interest rate futures can be used in conjunction with bond portfolios to provide the same kind of immunization. Both examples assumed parallel shifting yield curves. If the change in interest rates brings about non-parallel shifts in the yield curve, then the traditional, “bonds only” portfolio as well as the “bond-with-futures” approaches will give different results. Which method turns out to be superior would depend upon the pattern of interest rate changes that actually occurred.