Download
1 / 37
380 likes | 389 Views
A Briefing on Spring-2005 Atmospheric River Data Collection Activities. Presented on 8-Mar-05 by: Paul J. Neiman 1 Prepared by: P.J. Neiman 1 , F.M. Ralph 1 , G.A. Wick 1 , D.E. Kingsmill 2 1 NOAA/ETL; 2 NOAA/CIRES. NOAA P-3 Research Aircraft. General Atomics Altair UAV.

E N D
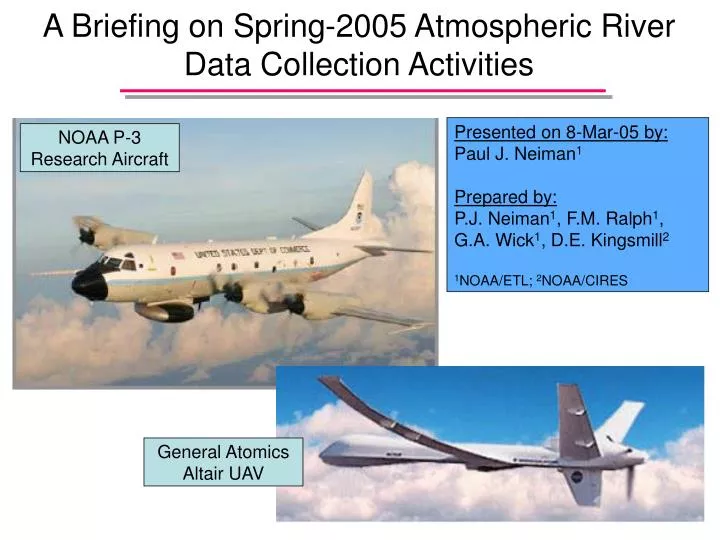
A Briefing on Spring-2005 Atmospheric RiverData Collection Activities Presented on 8-Mar-05 by: Paul J. Neiman1 Prepared by: P.J. Neiman1, F.M. Ralph1, G.A. Wick1, D.E. Kingsmill2 1NOAA/ETL; 2NOAA/CIRES NOAA P-3 Research Aircraft General Atomics Altair UAV
Presentation Outline • Motivation • Background • Expectations • Flight Planning • Weather Forecasting • Concluding Slide Outline and Contacts Key NOAA Contacts Weather-Climate Connection Marty Ralph (ETL) Randy Dole (CDC) Bill Neff (ETL) Jeff Whitaker (CDC) Paul Neiman (ETL) Spring 2005 Hawaii P-3 Campaign David Kingsmill (CIRES) Dave Jorgensen (NSSL) Paul Neiman (ETL) Gary Wick (ETL) Bob Zamora (ETL) Spring 2005 Altair UAV Demo Mike Aslaksen (NOS) Sara Summers (FSL) David Fahey (AL) Al Gasiewski (ETL) Brad Kearse (NMAO)
Motivation Motivation
Russian River, CA Flood Event of 18-Feb-04 Atmospheric River generates flooding Russian River, CA Flood Event CZD Russian River flooding in Monte Rio, California 18 February 2004 IWV (cm) GPS IWV data from near CZD: 14-20 Feb 2004 Bodega Bay Atmospheric river IWV (cm) IWV (inches) Cloverdale photo courtesy of David Kingsmill 10” rain at CZD in ~48 hours
La Conchita, CA Debris-flow Disaster of 10-Jan-05 Atmospheric river on 9 Jan 2005 La Conchita, CA Debris-flow Disaster of 10-Jan-05 Fatal mudslides and floods on 10 Jan 2005 IWV (cm) IWV (cm) Atmospheric River GPS IWV traces coastal zone S. California 4-day duration of S. CA 2-3 ft of rain in San Gabriel Mtns foothills Fatal mudslides 1400 UTC 7 – 1400 UTC 11 Jan05
Background Background
Zhu & Newell 1998: Model diagnostic study using the ECMWF • Atmos. rivers contain 95% of meridional water vapor flux at 35 latitude, • but in <10% of the zonal circumference. • Observational studies (Ralph et al. 2004, 2005; following slides) confirm • model results. Zhu & Newell 1998: Model diagnostic study using the ECMWF
CALJET study of low-level jet & atmospheric riverDropsonde data from NOAA P-3 research aircraft • CALJET study of low-level jet & atmospheric river • Dropsonde data from NOAA P-3 research aircraft
Winter season SSM/I satellite analysis methodology 19 November 1997 – 24 March 1998 Winter season SSM/I satellite analysis methodology19 November 1997 – 24 March 1998 Atmos. River Atmos. River
Ralph et al. (2004), Mon. Wea. Rev. (Atmospheric River) • 75% of total observed flux was within a 600 km wide zone ~4 km deep (1.5 x 10⁸ kg s-1 of meridional flux) • A methodology was developed to identify IWV plumes in SSM/I data (used as a proxy for atmos. rivers) • Using 312 satellite baselines, 75% of the IWV was confined to a zone 415 across • Maximum IWVs in the river core are nearly uncorrelated with IWVs just ~150 km away. GOES IWV data are normally absent in this core region. • GOES CTT & CTP, together with nearly coincident SSM/I IWV data, reveal that colder and higher cloud tops are associated with rivers having greater IWV content
Composite sounding located 500 km off CA coast in atmos. river & pre-cold-frontal LLJ • LLJ directed toward coast and situated at 1 km MSL • Most (75%) of pre-cold-frontal along-river moisture flux is below 2.5 km MSL • Moist neutral stratification below 2.8 km MSL, hence no resistance to orographic lifting • Overlapping set of conditions conducive to orographic rain enhancement in coastal mtns (future work will connect atmos. rivers to coastal rainfall/runoff) Ralph et al. (2005), Mon. Wea. Rev. Summary Schematic Atmospheric River
Expectations Expectations
What to expect for this spring? What to expect this spring Atmospheric River Hawaii Tropical Protuberance Hawaii
NOAA P-3: • Expand sample size of dropsondes in atmospheric rivers: assess natural variability • New geographic location • latitude: close to tropical IWV reservoir rather than in midlatitudes • longitude: central Pacific rather than eastern Pacific • Learn about structure of tropical protuberances & north wall of tropical IWV reservoir • Explore entrainment of tropical IWV into midlatitude atmospheric rivers • Data comparison with model simulations of atmospheric rivers Altair UAV: • Technology demonstration for unmanned aerial vehicles • First major applications test of a high-altitude, long-endurance aircraft for NOAA • NOAA testing potential for UAVs to bridge observational gaps over remote locales (e.g., oceans and poles) for research and operational applications What we hope to accomplish:
Flight Planning Flight Planning
NOAA P-3 target from Honolulu, Hawaii: Atmospheric River NOAA P-3 target from Honolulu, Hawaii: Atmospheric River 16-Feb-04; IWV (cm) Flight information *Dates: 20 Mar. to 9 Apr. *Number of flights: 3 *Cruising Alt: ~6 km *Cruising speed : ~130 m/s *Duration: 9.0-9.5 h *Range: ~4500 km Instrumentation *Dropsondes channels: 4 descent time: 7 min resolution: >60km *1-s flight-level *LF radar *Tail Doppler radar Atmospheric River Hawaii NOAA P-3 domain 1500 km radius SSM/I IWV (cm)
Atmospheric River Flight Strategy #1: Double Dropsonde Curtain Atmospheric River Flight Strategy #1: Double Dropsonde Curtain 16-Feb-04; IWV (cm) NOAA P-3 domain 1500 km radius 1000 km dropsonde curtains 18-20 dropsondes/curtain <40 total; 60 km spacing Flight altitude: 6 km SSM/I IWV (cm) Hawaii 1. P-3 speed: 130 m/s. 2. 7 min for dropsonde to reach ocean from 6 km MSL. 3. ~60 km minimum horizontal dropsonde resolution.
Atmospheric River Flight Strategy #2: Long Dropsonde Curtain Atmospheric River Flight Strategy #2: Long Dropsonde Curtain 1500 km dropsonde curtain 22-25 dropsondes 60 km spacing inner 1000 km 100 km spacing remainder Flight altitude: 6 km 16-Feb-04; IWV (cm) NOAA P-3 domain 1500 km radius SSM/I IWV (cm) Hawaii 1. P-3 speed: 130 m/s. 2. 7 min for dropsonde to reach ocean from 6 km MSL. 3. ~60 km minimum horizontal dropsonde resolution.
Atmospheric River Flight Strategy #3: Low-Level Transect & Dropsonde Curtain Atmospheric River Flight Strategy #3: Low-Level Transect & Dropsonde Curtain 16-Feb-04; IWV (cm) NOAA P-3 domain 1500 km radius 1200 km dropsonde curtain 20 dropsondes; 60 km spacing Flight altitude: 6 km MSL Low-level transect at ~1 km MSL SSM/I IWV (cm) Hawaii Spiral ascent to ~6 km MSL 1. P-3 speed: 130 m/s. 2. 7 min for dropsonde to reach ocean from 6 km MSL. 3. ~60 km minimum horizontal dropsonde resolution.
NOAA P-3 target from Honolulu, Hawaii: Tropical protuberance NOAA P-3 target from Honolulu, Hawaii: Tropical protuberance Flight information *Dates: 20 Mar. to 9 Apr. *Number of flights: 1 *Cruising Alt: ~6 km *Cruising speed : ~130 m/s *Duration: 9.0-9.5 h *Range: ~4500 km Instrumentation *Dropsondes channels: 4 descent time: 7 min resolution: >60km *1-s flight-level *LF radar *Tail Doppler radar 3-Feb-05; IWV (cm) Tropical Protuberance Hawaii NOAA P-3 domain 1500 km radius SSM/I IWV (cm)
Tropical Protuberance Flight Strategy: The Figure-4 Dropsonde Pattern Tropical Protuberance Flight Strategy: The Figure-4 Dropsonde Pattern 3-Feb-05; IWV (cm) NOAA P-3 domain 1500 km radius 1000-1400 km legs SSM/I IWV (cm) Hawaii 10-14 dropsondes per leg: 100 km spacing; 45 total. Flight altitude : 6 km 1. P-3 speed: 130 m/s. 2. 7 min for dropsonde to reach ocean from 6 km MSL. 3. ~60 km minimum horizontal dropsonde resolution.
Altair UAV Conceptual Flight Track: Target - Atmospheric Rivers Flight information *Dates: 1-22 April *Number of flights: 2 *Cruising Alt: ~14 km *Cruising speed : ~100 m/s *Duration: 12h, 21h *Range: ~7000 km for 21h Instrumentation *Passive microwave vertical sounder provides coarse vert. res. temp. and moisture profiles and cloud liquid water1. 16 Feb 04; IWV Altair UAV Conceptual Flight Track: Target - Atmospheric Rivers 1600 km leg Atmos. River Edwards AFB (EDW) 35N Max. range limit from EDW ~3500 km 21-h flight 25N Hawaii 15N 1See the following slide for a more complete description of the UAV goals and instrumentation 5N 150W 140W 130W 120W 110W IWV (cm)
Altair UAV: The final integrated sensor package and operational goals consists of the following: Combined ozone photometer and gas chromatograph instrument Demonstrate the smallest airborne 2 channel gas chromatograph and it capabilities of measuring up to twelve different trace gases that are important in climate change, stratospheric ozone depletion, and air quality. Ocean Color and Passive Microwave Vertical Sounder (1) Determine the capability to calibrate spaceborne ocean color sensors in near-coastal areas. Coastal areas are difficult to observe from space due to the influence of land on the broad footprints of satellites. (2) Determine the impact of clouds on spaceborne ocean color sensors data. The UAV can fly underneath cloud cover to provide calibrated ocean color data with which to intercompare with satellite sensors. (3) Determine the capability to detect water vapor jets and quantize their moisture flux prior to landfall. Measurement of moisture flux and structure is key to predicting precipitation and flood potential at landfall. Airborne Maritime Surveillance Electro Optical/Infrared (EOIR) Gyro Stabilized Imaging Sensor (1) Determine the capability and cost benefits of a UAV with a Maritime Surveillance EOIR sensor for fishery and marine sanctuary enforcement especially in remote areas. (2) Determine the capability and cost benefits of a combination Maritime Surveillance EOIR sensor for detecting and positively identifying marine mammals both in the water and on land for habitat and migration research. (3) Determine the capability and cost benefits of a UAV with a Maritime Surveillance EOIR sensor for determining the location of commercial and recreational fishing vessels for research correlating fish stocks and coral reef damage. Direct Geo-referenced Digital Camera (1) Determine the capability and cost benefits of a UAV equipped with a Direct Geo-referenced Digital Camera to gather data to accurately determine and assess the composition of both the marine and terrestrial resources in remote areas. (2) Determine the capability and cost benefits of a UAV equipped with a Direct Geo-referenced Digital Camera to gather data to determine the application for shoreline mapping and near shore bathymetry in remote areas. Research Environment for Vehicle-Embedded Analysis on Linux (REVEAL) system The REVEAL system as tested is a flexible “plug & play” sensor acquisition and processing system complete with an internal sensor suite and local area network hardware, and an open standards-based software framework for building dynamically reconfigurable network-centric vehicle- and environmental-monitoring systems.
SSM/I, F-15 Ascending Passes: March 16, 2005 0506 UTC EDW 0647 UTC 1 min Hawaii Satellite Validation As a secondary objective, try to coordinate P-3 and UAV flights with SSM/I, AMSR, AMSU, and TRMM satellite overpasses Satellite Validation
Weather Forecasting Weather Forecasting
>2 days prior to anticipated flight: Local forecaster (Paul Neiman/Bob Zamora) will look for atmospheric river and tropical protuberance signatures near Hawaii in GFS model • 1 day prior to anticipated flight: • local forecaster will look at GFS model and GOES/POES satellite imagery • coordination call with Hon. WFO at ~0945 MST (0645 HST) after 12z models in • contact chief scientist (CS) in Hon. regarding possible flight... get OK • create tentative flight plan using Dave Jorgensen’s F-Plan program • email flight-plan file to CS • Day of anticipated flight: • local forecaster will look at GFS model and GOES/POES satellite imagery • coordination call with Hon. WFO at ~0945 MST (0645 HST) after 12z models in • contact CS in Hon. for yes/no decision. If yes, tweak flight plan as needed • Take-off time will be ~0900-1100 HST; flight duration ~9.0 hours • email latest SSM/I IWV images and other pertinent info to CS during flight Weather Forecasting Procedure
What to look for when forecasting? Examine synoptic composite analyses based on conditions when atmospheric rivers and tropical protuberances are in our general domain of interest. What to look for when forecasting 70 atmospheric river days 57 tropical protuberance days
Synoptic composite analyses: Integrated water vapor (cm) Synoptic composite analyses: integrated water vapor (cm) AR = atmospheric river composite TP = tropical protuberance AR; mean TP; mean Hawaii
925 mb Geopotential heights (m) 925 mb Geopotential heights (m) TP; mean AR; mean H H H H TP; anom AR; anom + + + _ _
925 mb Meridional wind speed (m/s) 925 mb Meridional wind speed (m/s) TP; mean AR; mean
500 mb Geopotential heights (m) 500 mb Geopotential heights (m) AR; mean TP; mean TP; anom AR; anom + + _ _
600 mb Vertical velocity (m/s; <0 is ascent) 600 mb Vertical velocity (m/s; <0 is ascent) AR; mean TP; mean UP UP UP UP UP DN DN DN DN UP
Rainrate (mm/h) Rainrate (mm/h) TP; mean AR; mean
Last Winter: Last Winter & Today Today:
Concluding Slide Concluding Slide Data collected from the NOAA P-3 and Altair UAV aircraft will be analyzed to gain a greater understanding of the structural characteristics of atmospheric rivers across a broad latitude/longitude domain over the Pacific Ocean, and to better assess the role of these rivers in transporting latent and sensible heat poleward from the tropics and in contributiing to flooding along the U.S. West Coast References of atmospheric rivers material used in this presentation: Ralph, F.M., P.J. Neiman, and R. Rotunno, 2005: Dropsonde Observations in Low-Level Jets Over the Northeastern Pacific Ocean from CALJET-1998 and PACJET-2001: Mean Vertical-Profile and Atmospheric-River Characteristics. Mon. Wea. Rev., 133, in press. Ralph, F.M., P.J. Neiman, and G.A. Wick, 2004: Satellite and CALJET aircraft observations of atmospheric rivers over the eastern North-Pacific Ocean during the winter of 1997/98. Mon. Wea. Rev., 132, 1721-1745. Zhu, Y., & R.E. Newell, 1998: A proposed algorithm for moisture fluxes from atmospheric rivers. Mon. Wea. Rev., 126, 725-735. Additional references related to atmospheric rivers: Bao, J.-W., S.A. Michelson, P.J. Neiman, F.M. Ralph, and J.M. Wilczak, 2005: Interpretation of enhanced integrated water-vapor bands associated with extratropical cyclones: Their formation and connection to tropical moisture. Mon. Wea. Rev., 133, accepted pending revisions. Neiman, P.J., F.M. Ralph, A.B. White, D.A. Kingsmill, and P.O.G. Persson, 2002: The statistical relationship between upslope flow and rainfall in California’s coastal mountains: Observations during CALJET. Mon. Wea. Rev., 130, 1468-1492.