Download
1 / 22
220 likes | 225 Views
Viral load distribution 2012 among persons l iving w ith HIV and persons newly diagnosed Georgia, 2011. Adults and adolescents living with HIV, Georgia , 2012 . Adults and adolescents >= age 13, diagnosed by 09/30/2011, living 12/31/2012, Georgia = 46,495

E N D
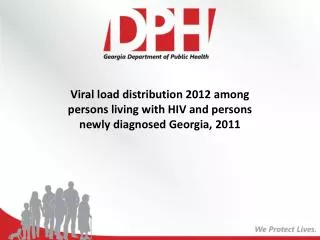
Viral load distribution 2012 among persons living with HIVand persons newly diagnosed Georgia, 2011
Adults and adolescents living with HIV, Georgia, 2012 Adults and adolescents >= age 13, diagnosed by 09/30/2011, living 12/31/2012, Georgia = 46,495 Engaged in care >= 1 CD4 or VL in 2012 Retained in care >= 2 CD4 or VL at least 3 months apart in 2012 Viral suppression (VS) = VL<200 copies/ml Estimated undiagnosed based on CDC projections for proportion undiagnosed nationally
Viral suppression • Individuals with an undetectable viral load (VL) or VL<200 copies/ml on the last measurement in 2012 are considered virally suppressed • Individuals with a VL >200 or who have had no VL measured in 2012 are considered to be not virally suppressed • What proportion of those not virally suppressed have a documented VL >200 versus no VL measured in 2012?
Viral load (VL) among adults and adolescents living with HIV, Georgia, 2012 Adults and adolescents >= age 13, diagnosed by 09/30/2011, living 12/31/2012, Georgia = 46,495 VL<200 copies/ml = viral suppression VL >200 copies/ml = no viral suppression VL Missing = no apparent viral load measured in 2012
Viral load (VL) among adults and adolescents living with HIV, by sex, Georgia, 2012 Adults and adolescents >= age 13, diagnosed by 09/30/2011, living 12/31/2012, Georgia = 46,495 VL<200 copies/ml = viral suppression VL >200 copies/ml = no viral suppression VL Missing = no apparent viral load measured in 2012
Viral load (VL) among adults and adolescents living with HIV, by race/ethnicity, Georgia, 2012 Adults and adolescents >= age 13, diagnosed by 09/30/2011, living 12/31/2012, Georgia = 46,495 VL<200 copies/ml = viral suppression VL >200 copies/ml = no viral suppression VL Missing = no apparent viral load measured in 2012 *American Indian/Alaska Native, Asian and Native Hawaiian/Pacific Islander groups together constitute <2% of males living with HIV in Georgia and are grouped with those of mixed or unknown race/ethnicity
Viral load (VL) among adult and adolescents living with HIV, by transmission category*, Georgia, 2012 Adults and adolescents >= age 13, diagnosed by 09/30/2011, living 12/31/2012, Georgia = 46,495 VL<200 copies/ml = viral suppression VL >200 copies/ml = no viral suppression VL Missing = no apparent viral load measured in 2012 *MSM = Male to male sexual contact IDU = Injection drug use MSM/IDU = Male to male sexual contact and injection drug use HET = Heterosexual contact with a person known to have, or to be at high risk for, HIV infection Other = hemophilia, blood transfusion, perinatal exposure, and risk factor not reported or not identified
Viral load (VL) among adult and adolescent males living with HIV, by transmission category*, Georgia, 2012 Adult and adolescent males >= age 13, diagnosed by 09/30/2011, living 12/31/2012, Georgia = 34,510 VL<200 copies/ml = viral suppression VL >200 copies/ml = no viral suppression VL Missing = no apparent viral load measured in 2012 *MSM = Male to male sexual contact IDU = Injection drug use MSM/IDU = Male to male sexual contact and injection drug use HET = Heterosexual contact with a person known to have, or to be at high risk for, HIV infection Other = hemophilia, blood transfusion, perinatal exposure, and risk factor not reported or not identified
Viral load (VL) among adult and adolescent females living with HIV, by transmission category*, Georgia, 2012 Adult and adolescent males >= age 13, diagnosed by 09/30/2011, living 12/31/2012, Georgia = 11,715 VL<200 copies/ml = viral suppression VL >200 copies/ml = no viral suppression VL Missing = no apparent viral load measured in 2012 * IDU = Injection drug use HET = Heterosexual contact with a person known to have, or to be at high risk for, HIV infection Other = hemophilia, blood transfusion, perinatal exposure, and risk factor not reported or not identified N=
Viral load (VL) among adults and adolescents living with HIV, by current age (years) Georgia, 2012 Adults and adolescents >= age 13, diagnosed by 09/30/2011, living 12/31/2012, Georgia = 46,495 VL<200 copies/ml = viral suppression VL >200 copies/ml = no viral suppression VL Missing = no apparent viral load measured in 2012
Viral load (VL) among Black MSM* living with HIV, Georgia, 2012, by current age (years) Adult and adolescent males >= age 13, diagnosed by 09/30/2011, living 12/31/2012, Georgia = 15,657 VL<200 copies/ml = virally suppressed VL >200 copies/ml = not virally suppressed VL Missing = no apparent viral load measured in 2012 Multiple imputation is used to estimate number of persons in each transmission category. *MSM = Male to male sexual contact
Viral load (VL) among White MSM* living with HIV, Georgia, 2012, by current age (years) Adult and adolescent males >= age 13, diagnosed by 09/30/2011, living 12/31/2012, Georgia =6,928 VL<200 copies/ml = viral suppression VL >200 copies/ml = no viral suppression VL Missing = no apparent viral load measured in 2012 Multiple imputation is used to estimate number of persons in each transmission category. *MSM = Male to male sexual contact
Viral load (VL) among Hispanic/Latino MSM* living with HIV, Georgia, 2012, by current age (years) Adult and adolescent males >= age 13, diagnosed by 09/30/2011, living 12/31/2012, Georgia =1,388 VL<200 copies/ml = viral suppression VL >200 copies/ml = no viral suppression VL Missing = no apparent viral load measured in 2012 Multiple imputation is used to estimate number of persons in each transmission category. *MSM = Male to male sexual contact
Viral load (VL) on last VL measured in 2012 among adults and adolescents, diagnosed 2011, Georgia
Viral load (VL)* among adults and adolescents, diagnosed 2011, Georgia, Persons >= age 13, diagnosed 2011, alive 15 months after diagnosis, Georgia *Most recent viral load measured in 2012 VL<200 copies/ml = viral suppression VL >200 copies/ml = no viral suppression VL Missing = no apparent viral load measured in 2012
Viral load (VL)* among adults and adolescents, diagnosed 2011, Georgia, by sex Persons >= age 13, diagnosed 2011, alive 15 months after diagnosis, Georgia *Most recent viral load measured in 2012 VL<200 copies/ml = viral suppression VL >200 copies/ml = no viral suppression VL Missing = no apparent viral load measured in 2012
Viral load (VL)* among adults and adolescents, diagnosed 2011, Georgia, by race/ethnicity Persons >= age 13, diagnosed 2011, alive 15 months after diagnosis, Georgia *Most recent viral load measured in 2012 VL<200 copies/ml = viral suppression VL >200 copies/ml = no viral suppression VL Missing = no apparent viral load measured in 2012 American Indian/Alaska Native, Asian and Native Hawaiian/Pacific Islander groups together constitute <2% of males living with HIV in Georgia and are grouped with those of mixed or unknown race/ethnicity
Viral load (VL)* among adult and adolescent males, diagnosed 2011, Georgia, by transmission category Males >= age 13, diagnosed 2011, alive 15 months after diagnosis, Georgia *Most recent viral load measured in 2012 VL<200 copies/ml = viral suppression VL >200 copies/ml = no viral suppression VL Missing = no apparent viral load measured in 2012* MSM = Male to male sexual contact IDU = Injection drug use MSM/IDU = Male to male sexual contact and injection drug use HET = Heterosexual contact with a person known to have, or to be at high risk for, HIV infection Other = hemophilia, blood transfusion, perinatal exposure, and risk factor not reported or not identified
Viral load (VL)* among adult and adolescent females, diagnosed 2011, Georgia, by transmission category Females>= age 13, diagnosed 2011, alive 15 months after diagnosis, Georgia *Most recent viral load measured in 2012 VL<200 copies/ml = viral suppression VL >200 copies/ml = no viral suppression VL Missing = no apparent viral load measured in 2012 IDU = Injection drug use HET = Heterosexual contact with a person known to have, or to be at high risk for, HIV infection Other = hemophilia, blood transfusion, perinatal exposure, and risk factor not reported or not identified
Viral load (VL)* among adults and adolescents, diagnosed 2011, Georgia, by age at diagnosis (years) Persons >= age 13, diagnosed 2011, living 15 months after diagnosis, Georgia *Most recent viral load measured in 2012 VL<200 copies/ml = viral suppression VL >200 copies/ml = no viral suppression VL Missing = no apparent viral load measured in 2012
Limitations • Incomplete reporting • Missing data for race/ethnicity, sex, and current address • Lack of transmission category information • Multiple imputation use to redistribute risk when missing • Missing laboratory reports may lead to underestimation of viral suppression • This analysis cannot identify causes of poor viral suppression
FOR MORE INFORMATION CONTACT: Georgia Department of Public Health HIV/AIDS Epidemiology Program http://health/state.ga.us/epi/hivaids