Download
1 / 50
500 likes | 643 Views
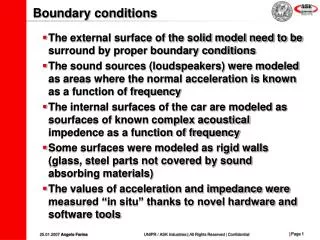
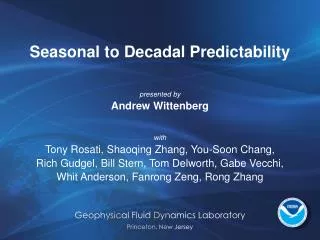
The Role of Initial and Boundary Conditions for Sub-Seasonal Atmospheric Predictability. Thomas Reichler Scripps Institution of Oceanography University of California San Diego La Jolla, CA (now at: NOAA-GFDL / Princeton University, Princeton NJ). Outline. Motivation and Goal Methodology

E N D
The Role of Initial and Boundary Conditions for Sub-Seasonal Atmospheric Predictability Thomas Reichler Scripps Institution of Oceanography University of California San Diego La Jolla, CA (now at: NOAA-GFDL / Princeton University, Princeton NJ)
Outline • Motivation and Goal • Methodology • Predictability • temporal evolution • horizontal distribution • vertical structure • The initial condition effect and the Antarctic oscillation • Summary
Elements of predictability Physical model Initial conditions (ICs) Boundary conditions (BCs)
Goal of this study • Sub-seasonal (2 weeks to 2 months) predictability of the atmosphere • = IC (weather) + BC (climate) prediction problem • ICsinitially very strong, but rapid decrease in time • classical predictability range: ~ 2 weeks • beyond that: weak or zero IC influence!? • persistent features (e.g. blocking, major modes, stratosphere) • periodic features (e.g. MJO) • BCseffects are weak, require long time averaging • recent studies: mostly seasonal and longer, impacts of ENSO • sub-seasonal range: relatively short averaging period • ocean & land • tropics & extratropics
Outline • Motivation and Background • Methodology • Predictability • temporal evolution • spatial distribution • vertical structure • The initial condition effect and the Antarctic oscillation • Summary
Experimental Design • AGCM with prescribed SSTs • Different “qualities” of ICs and BCs, find out how important they are • Base runs • observed (2x) or climatological SST • continuously over many years • to produce ICs for subsequent experiments • Experiments • branching off from base runs • 107 days: DJFM and JJAS (start on the 15th) • 10-20 members, from perturbed ICs (breeding) • 22 years (1979-2000) • different combinations of ICs and BCs
Experiments • experiments (IC’=0: initial conditions from base run with BC’=0)
Verification Strategy • verification 10-member ensemble-mean of experiment against 1 member of “observation” • “observation” a. one realization of ICBC (perfect model skill) repeat 20 times and average no model errors > upper limit of predictability (this is what I mostly show) b. NCEP reanalysis (real world skill) • measure of skill correlation of geopotential spatial or temporal (year-to-year)
10 extratropical tropopause 18 The Model • NCEP seasonal forecasting model (e.g. Kanamitsu et al. 2002) • originates from MRF, similar to reanalysis-2 model • T42 (300km) L28 • RAS Convection: Moorthi and Suarez (1992) • SW: Chow (1992) • LW: Chow & Suarez (1994) • Clouds: Slingo (1987) • Gravity wave drag: Alpert et al. (1988) • 2-layer soil model: Pan & Mahrt (1987) • Orography: smoothed • Ozone: zonal mean climatology
Outline • Motivation and Background • Methodology • Predictability • temporal evolution • spatial distribution • vertical structure • The initial condition effect and the Antarctic oscillation • Summary
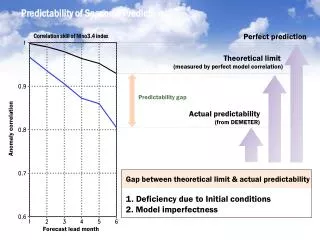
correlation correlation lead time (days) lead time (days) Classical predictability evolution of spatial AC for global Z500 during DJFM CC vs. CC (IC’=0, BC’=0)
Effects of IC’ evolution of spatial AC for global Z500 during DJFM 30 day averages IC vs. IC correlation CC vs. CC lead time (days) • initial condition effect has very long time scale • anomalous initial conditions (IC’) lead to prolonged predictability • possible reason: excitation of low-frequency modes by BC’
4 weeks ICs dominate for first 4 weeks (3 weeks during ENSO, 5 weeks during neutral) Effects of IC’ and BC’ evolution of spatial AC for NH Z500 during DJFM verified against ICBC instantaneous 30 days 90 days correlation lead time (days) lead time (days) lead time (days)
Southern Hemisphere evolution of spatial AC for SH Z500 during DJFM verified against ICBC instantaneous 30 days 90 days 7 weeks
Tropics evolution of spatial AC of tropical Z200 during DJFM verified against ICBC 30 days instantaneous 90 days 3 weeks
Summary: Effects of IC’ and BC’ Time scale for: IC = BC
Effect of model uncertainty evolution of spatial AC of NH Z500 during DJFM ICBC/ICBC vs. ICBC-r/reanalysis 90 days averages = model error
Outline • Motivation and Background • Methodology • Predictability • temporal evolution • horizontal distribution • vertical structure • The initial condition effect and the Antarctic oscillation • Summary
Pacific North American region (PNA) Tropics Pacific South American region (PSA) Antarctica Horizontal structure I January monthly mean (week 3-6), Z500, temporal correlation ICBC temporal correlation latitude longitude
Horizontal structure II January monthly mean (week 3-6), Z500, temporal correlation ICBC iBC BC IC
major modes Z500 (JFM) predictability Z500 (Jan) ICBC ICBC NA NAO PNA persistent boundary forcing SO AAO IC atmospheric persistence Effects of persistence persistence Z500 (Jan) ICBC IC
Outline • Motivation and Background • Methodology • Predictability • temporal evolution • horizontal structure • vertical structure • The initial condition effect and the Antarctic oscillation • Summary
Vertical structure I ICBC: temporal correlations of monthly and zonal mean geopotential Jan Feb Mar temporal correlation height latitude latitude latitude
Vertical structure II Jan Feb Mar ICBC IC-ICBC BC-ICBC
Vertical structure III: neutral ENSO Mar Jan Feb ICBC IC-ICBC BC-ICBC
Outline • Motivation and Background • Methodology • Predictability • temporal evolution • spatial distribution • vertical structure • The initial condition effect and the Antarctic oscillation • Summary
Antarctic Oscillation (AAO) January, Z500 ICBC-A EOF1 (59%) ICBC-B (0.81) IC (0.80) BC (0.10)
AAO index (Jan 1) and forecast skill (Jan) spatial AC for SH Z500 during January, verified against ICBC ICBC (0.53) IC (0.75) El Nino La Nina iBC (0.05) BC (-0.15) AAO index (Jan 1) AAO index (Jan 1)
Outline • Motivation and Background • Methodology • Predictability • temporal evolution • spatial distribution • vertical structure • The initial condition effect and the Antarctic oscillation • Summary
Summary • The effects of ICs on forecast skill • were detectable for ca. 8 week, • were more important than BCs for ca. 4 weeks, • were particularly important over Antarctica, the Tropics, and the lower stratosphere. • Regions of large skill coincided with regions of major modes. • Total skill (ICBC) can be understood as the sum of IC and BC produced skill (ICBC=BC+IC). • IC produced skill came mostly from atmospheric persistence in relationship with major modes. • Conclusion: Do not underestimate the importance of ICs for seasonal to sub-seasonal forecasts.
Scale variations Saturation of spectral error energy globally, Z500, DJFM Maximum gain from ICBC 0-4 d 4-10 0-4 d 10-20 20-40 40-100 ICBC IC BC n (total) m (zonal)
Perfect ENSO JFM Z JAN FEB MAR ICBC IC-ICBC BC-ICBC
Real world JFM Z JAN FEB MAR ICBC BC-ICBC
Perfect JAS Z JUL AUG SEP ICBC IC-ICBC BC-ICBC
Vertical structure II Feb Jan Mar ICBC IC iBC- ICBC BC- ICBC latitude latitude latitude
Predictability of MJO 30-70 day filtered 200 hPa velocity potential correlation lead time (days) ~ 4 weeks • initial conditions are crucial • boundary conditions are important
Real world, Z500, DJFM verified against NCEP/NCAR reanalysis 30 days 90 days NH = model error SH
Temporal correlation: Z500 JAN (week 3-6) FEB (week 7-10) MAR (week 11-14) ICBC BC IC significant IC influence
Perfect world: JFM Zonal mean temporal correlation: Z500 JAN FEB MAR ICBC BC ICBC BC IC ICBC IC
Perfect world: JAS Zonal mean temporal correlation: Z500 JUL AUG SEP ICBC IC ICBC IC BC ICBC BC
Real world: JFM Zonal mean temporal correlation: Z200 JAN FEB MAR ICBC BC ICBC BC
Outline I. Introduction II. Experimental Design III. Results a. Time evolution of skill and scale variations b. Regional variations and vertical structure c. Antarctic oscillation d. Tropical predictability IV. Summary
107 time (d) 0 U850 (10N-10S) temporal correlation IC ICBC BC-ICBC Atl Ind W Pac Atl Atl Ind W Pac Atl Atl Ind W Pac Atl