Download
1 / 70
720 likes | 918 Views
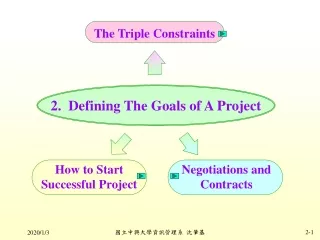
Defining the Project. Kusdhianto Setiawan. Gadjah Mada University. Performance. Quality. Cost. Time. Project Management Trade-Offs. Figure 3-1. Kusdhianto Setiawan. Gadjah Mada University. Time. Performance. Cost. Constrain. Enhance. Accept. Project Priority Matrix. Figure 3-2.

E N D
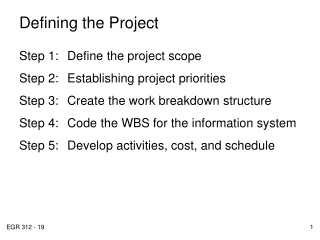
Defining the Project Kusdhianto Setiawan Gadjah Mada University
Performance Quality Cost Time Project Management Trade-Offs Figure 3-1 Kusdhianto Setiawan Gadjah Mada University
Time Performance Cost Constrain Enhance Accept Project Priority Matrix Figure 3-2 Kusdhianto Setiawan Gadjah Mada University
Complete project 1 Project Major deliverables 2 Deliverable Supporting deliverables Subdeliverable 3 Lowest managementresponsibility level 4 Lowest subdeliverable Grouping of work packagesfor monitoring progress andresponsibility 5 Cost account* Work package Identifiable work activities Hierarchical Breakdown of the WBS Figure 3-3 Level Hierarchical breakdown Description *This breakdown groups work packages by type of work within a deliverable and allows assignment ofresponsibility to an organizational unit. This extra step facilities a system for monitoring project progress(discussed in Chapter 12). Kusdhianto Setiawan Gadjah Mada University
Personal computerprototype Level1 Moreitems Vendor,software,applications Mouse,keyboard,voice Microprocessorunit Diskstorageunits 2 ~ ~ Floppy Optical Hard Internalmemoryunit BIOS (basicinput/outputsystem) 3 ~ ~ RAM ROM I/O File Utilities 4 ~ ~ ~ ~ ~ Lowest manageablesubdeliverables Chassisframe Circuitboard Read/writehead Motor 5 WP-1M WP-1 CB WP-1 CF WP-1 RWH WP-2 CB WP-2 CF WP-2 RWH WP-3 CB WP-3 CF WP-3 RWH WP-4 CB WP-4 RWH WP-5 CB WP-5 RWH WP-6 CB WP-7 CB Work packages Work Breakdown Structure Figure 3-4 Kusdhianto Setiawan Gadjah Mada University
Personal computerprototype Level1 Moreitems 1.0 1.3 1.1 1.4 1.2 Vendor,software,applications Mouse,keyboard,voice Microprocessorunit Diskstorageunits 2 1.4.1 1.4.2 ~ ~ 1.1.1 1.1.2 1.1.3 Internalmemoryunit BIOS (basicinput/outputsystem) 3 Floppy Optical Hard ~ ~ 1.4.1.1 1.4.1.2 1.4.2.1 1.4.2.2 1.4.2.3 4 RAM ROM I/O File Utilities ~ ~ ~ ~ ~ Lowest manageablesubdeliverables 1.1.3.1 1.1.3.2 1.1.3.3 1.1.3.4 5 Chassisframe Circuitboard Read/writehead Motor Cost accountnumber Cost 1.1.3.4.1 account Cost Cost account account Cost Cost account account Cost account Cost account Design Manufacturing Production Work packages WP1.1.3.4.2.1 WP1.1.3.4.2.2 WP1.1.3.4.2.3 Organization Test Purchasing Budget byperiod Software Integration of WBS and OBS Figure 3-5 Time Kusdhianto Setiawan Gadjah Mada University
Read/Write Head Design Figure 3-8 Work package cost estimate Kusdhianto Setiawan Gadjah Mada University
$6,000 5,000 4,000 Costs 3,000 2,000 Committed Actual cost 1,000 Scheduled budget Project Duration Three Views of Cost Figure 3-9 Kusdhianto Setiawan Gadjah Mada University
Developing a Network Plan Kusdhianto Setiawan Gadjah Mada University
A B C Level 1 - Milestone Plan D E F Level 2 - Plans Level 3 - Plans WP-1 WP-4 WP-3 WP-2 Rollup of Network Plans Figure 4-1 Kusdhianto Setiawan Gadjah Mada University
Lowestelement Circuitboard BP-10-1 AD-1-1D-1-2 DP-10-2 FS-22-2 KT-13-1 Designcostaccount OrganizatioUnits DesignWP D-1-1 SpecificationsWP D-1-2 Documentation CS-22-1 Productioncostaccount ProductionWP P-10-1 Proto 1WP P-10-2 Final Proto 2 BProto 15 Testcostaccount Test systemsWP T-13-1 Test ASpecificationsand documentation2 DFinalproto 24 FFinalsoftware2 KTest3 Softwarecostaccount SoftwareWP S-22-1 Software preliminaryWP S-22-1 Software final version CPreliminarysoftware3 WBS/Work Packages to Network Figure 4-2 Kusdhianto Setiawan Gadjah Mada University
J, K, & L can all begin atthe same time, if you wish(they need not occursimultaneously) Y Z X Y Z M L X K C J A B A is preceded by nothingB is preceded by AC is preceded by B but All (J, K, L) must becompleted before M canbegin (A) (C) Y and Z are preceded by X Z is preceded by X and Y Y and Z can begin at the same time, if you wish AA is preceded by X and Y AA (B) (D) Activity-on-Node Network Fundamentals Figure 4-3 Kusdhianto Setiawan Gadjah Mada University
KOLL BUSINESS CENTERCounty Engineers Design Department EF Activity-on-Node Network Fundamentals Figure 4-6 Kusdhianto Setiawan Gadjah Mada University
KOLL BUSINESS CENTERCounty Engineers Design Department Activity-on-Node Network Forward Pass Figure 4-7 20 15 35 200 20 15 10 EF Kusdhianto Setiawan Gadjah Mada University
185 20 185 5 20 10 15 20 KOLL BUSINESS CENTERCounty Engineers Design Department LS Activity-on-Node Network Backward Pass Figure 4-8 Kusdhianto Setiawan Gadjah Mada University
185 20 15 20 185 20 5 15 10 20 10 15 20 KOLL BUSINESS CENTERCounty Engineers Design Department LS EF Activity-on-Node Network with Slack Figure 4-9 Kusdhianto Setiawan Gadjah Mada University
LegendR = ResponsibilityC = ContributesA = Advises OrganizationUnit/Individual Activities Software Conversion ProjectResponsibility Matrix Figure 4-10 Kusdhianto Setiawan Gadjah Mada University
Softwaredevelopment 2 18 2 2022 40 Orderstandardparts 3 15 2 1715 30 7 8 Test Assemble Orderreview 1 540 4540 45 1030 4030 40 20 20 2 Producestandardparts 4 10 2 12 5 15 Legend Manufacturecustomhardware 6 8 # Activity 1515 3015 30 Designcustom parts 5 DurationES EFLS LF 13 2 12 5 15 Air Control Inc., Custom OrderProject—Network Diagram Figure 4-12 Kusdhianto Setiawan Gadjah Mada University
2 Order review Design custom parts 13 Order standard parts 15 Produce standard parts 10 18 Software development Manufacture customhardware 15 10 Assemble 5 Test 0 7 14 21 28 35 42 49 Air Control Inc., Custom OrderProject—Gantt Chart Figure 4-13 Kusdhianto Setiawan Gadjah Mada University
Softwaredevelopment 2 18 2-Jan 20-Jan22-Jan 9-Jan Order standard parts 3 15 2-Jan 17-Jan 15-Jan 30-Jan 7 8 Test Assemble Orderreview 1 5 9-Jan 14-Jan 9-Jan 14-Jan 10 30-Jan 9-Jan 30-Jan 9-Jan 2 1-Jan 2-Jan 1-Jan 2-Jan Produce standard parts 4 10 2-Jan 12-Jan 5-Jan 15-Jan Legend Manufacturecustom hardware 6 8 # Activity Designcustom parts 15 15-Jan 30-Jan 15-Jan 30-Jan 5 DurationES date EF dateLS date LF date 13 2-Jan 15-Jan 2-Jan 15-Jan Air Control Inc., Custom OrderProject—Network with Dates Figure 4-14 Kusdhianto Setiawan Gadjah Mada University
Trench1/3 Trench1/3 Trench1/3 Lay pipe1/3 Lay pipe1/3 Lay pipe1/3 Refill1/3 Refill1/3 Refill1/3 Example of Laddering UsingFinish-to-Start Relationship Figure 4-15 AON network Kusdhianto Setiawan Gadjah Mada University
Lag 2 X Y Finish-to-Start Relationship Figure 4-16 Kusdhianto Setiawan Gadjah Mada University
A B ActivityM ActivityP ActivityN ActivityQ Lag 5 Start-to-Start Relationship Figure 4-17 Kusdhianto Setiawan Gadjah Mada University
Trench1 mile Lay pipe1 mile Lag 3 Refill1 mile Lag 3 Use of Lags to Reduce Detail Figure 4-18 Kusdhianto Setiawan Gadjah Mada University
Prototype Lag 4 Testing Finish-to-Finish Relationship Figure 4-19 Kusdhianto Setiawan Gadjah Mada University
Testing Systemdocumentation Lag 3 Start-to-Start Relationship Figure 4-20 Kusdhianto Setiawan Gadjah Mada University
Lag 4 Code Lag 2 Debug Combination Relationships Figure 4-21 Kusdhianto Setiawan Gadjah Mada University
Lag 10 Lag 5 Lag 10 Legend Lag 5 Lag 10 Network Using Lags Figure 4-22 Kusdhianto Setiawan Gadjah Mada University
Legend Hammock Activity Example Figure 4-23 Kusdhianto Setiawan Gadjah Mada University
Managing Risk Kusdhianto Setiawan Gadjah Mada University
Risk Cost High Cost to fixrisk event Chances of risksoccurring Low Project life cycle Risk Event Graph Figure 5-1 Kusdhianto Setiawan Gadjah Mada University
Detectiondifficulty-LMH Severity-LMH Chance-LMH When Risk event Risk Assessment Matrix Figure 5-2 Kusdhianto Setiawan Gadjah Mada University
Best-case schedule 10% 470 days Baseline schedule 50% 500 days Worst-case schedule 90% 590 days Actual tracking schedule Forecast completion schedule Actual schedule 300 days 550 days Risk Schedules Figure 5-3 Kusdhianto Setiawan Gadjah Mada University
Accept, reduce,share, transfer Contingencyplan Risk event Trigger Responses to Risk Matrix Figure 5-4 Kusdhianto Setiawan Gadjah Mada University
3/29/ Y2K-Machine Dept. Project _________________Originator ________________ Date _________________ Ext. 4942 CEG Phone ________________ Impact Areas Baseline Impact 1.3M Deliverable # __________ Scope Contingency 1.313M Work Package # __________ X Staff X Budget 1.31M Cost Account # __________ Equipment Schedule X X IS-M Dept. Organization Unit __________ Description of change Install Y2K compatible chip in six computer controlled milling machines Justification (include impact if not implemented) Reprogramming cost is higher than estimated, and risk of old chips failing is higherthan estimated. (Eliminating reprogramming cost is -$10,000. Cost of Y2K chipsinstalled is +$15,000) Disposition Priority Funding Source X Approve Mgmt. Reserve $ _____________ Emergency Approve as amended 5,000. X Urgent Budget. Reserve $ _____________ Disapprove Routine Other $ _____________ Deferred S.P 4/7/ Authorized _________________ Scheduled start _________________ 4/3/ 5/10/ Date ______________________ Scheduled finish ________________ Change Request Figure 5-5 Kusdhianto Setiawan Gadjah Mada University
Chapter 6 Reducing Project Time Kusdhianto Setiawan Gadjah Mada University
60 Total costs Optimumcost-timepoint 50 40 Low-costplan duration point 30 Costs Direct costs 20 Indirect costs 10 0 4 6 8 10 12 14 16 Project duration Project Cost-Time Graph Figure 6-1 Kusdhianto Setiawan Gadjah Mada University
Crashcost Crash point $800 600 Normalpoint Normalcost Activity cost 400 200 0 0 5 10 Activity duration (units) Activity Graph Figure 6-2 Kusdhianto Setiawan Gadjah Mada University
Total direct cost $450 Legend A C G A F E B D E D F G C B 8 2x 3 6 10 11 5 6 6 6 10 5 11 8 Time 25 Time 24 ACT DUR Initial totaldirect cost $ 450 Totaldirect cost $ 470 (a) (b) Activities changed A$20 Cost-Time Trade-Off Example Figure 6-3 Kusdhianto Setiawan Gadjah Mada University
Totaldirect cost $ 495 Time 23 Activities changed D$25 (a) Totaldirect cost $ 525 Time 22 Activities changed F$30 E D A G C F A E B G A B E D C B G F D C F 5 8 10 4x 7 6 2x 10 6 6 6 2x 9 2x 6 10 4x 10 6 9x 6 (b) Totaldirect cost $ 610 Time 21 Activities changed F D E $30 $25 $30 (c) Cost-Time Trade-Off Example (continued) Figure 6-4 Kusdhianto Setiawan Gadjah Mada University
Summary Costs by Duration Figure 6-5 Kusdhianto Setiawan Gadjah Mada University
Totalprojectcost Optimumcost-timepoint $1000 800 $775 Totaldirectcost 600 Cost 400 Totalindirectcost 200 0 20 21 22 23 24 25 Duration (units) Project Cost-Time Graph Figure 6-6 Kusdhianto Setiawan Gadjah Mada University
Chapter 7 Resource Scheduling Kusdhianto Setiawan Gadjah Mada University
Technical constraints Pour Frame Roof (A) Design Code Test Purchaserefreshments Resource constraints Decoratehall Reception Plan (B) Hire band Purchaserefreshments Decoratehall (C) Reception Hire band Plan Constraint Examples Figure 7-1 Kusdhianto Setiawan Gadjah Mada University
Legend Time Constrained Network Figure 7-2a Kusdhianto Setiawan Gadjah Mada University
Time Constrained Network Figure 7-2b ES resource load chart ID RES DUR ES LF TS 0 1 2 3 4 5 6 7 8 9 10 11 12 Early start leveled resource profile 0 1 2 3 4 5 6 7 8 9 10 11 12 5 4 3 2 1 Total resource load Kusdhianto Setiawan Gadjah Mada University
Leveled Resource Schedule Figure 7-3a Leveled resource schedule A ID RES DUR ES LF TS 0 1 2 3 4 5 6 7 8 9 10 11 12 Leveled resource profile 0 1 2 3 4 5 6 7 8 9 10 11 12 5 4 3 2 1 Kusdhianto Setiawan Gadjah Mada University
Leveled Resource Schedule Figure 7-3b Leveled resource schedule B ID RES DUR ES LF TS 0 1 2 3 4 5 6 7 8 9 10 11 12 Leveled resource profile 0 1 2 3 4 5 6 7 8 9 10 11 12 5 4 3 2 1 Kusdhianto Setiawan Gadjah Mada University
Legend Resource Constrained Schedulethrough Period 2-3 Figure 7-4a Kusdhianto Setiawan Gadjah Mada University
13 14 ID RES DUR ES LF TS 0 1 2 3 4 5 6 7 8 9 10 11 12 ES resource load chart 13 14 ID RES DUR ES LF TS 0 1 2 3 4 5 6 7 8 9 10 11 12 3 1 Leveled resource profile Resource Constrained Schedulethrough Period 2-3 Figure 7-4b Kusdhianto Setiawan Gadjah Mada University