Download
1 / 12
120 likes | 278 Views
Effects of Climate Change on the Great Lakes. ELIORA BUJARI May 5, 2009. Objective. Look at streamflow, precipitation, and temperature measurements over the past fifty eight years to study any statistical trends that indicate the effects of climate change on the Great Lakes.

E N D
Effects of Climate Change on the Great Lakes ELIORA BUJARI May 5, 2009
Objective • Look at streamflow, precipitation, and temperature measurements over the past fifty eight years to study any statistical trends that indicate the effects of climate change on the Great Lakes. • Use these trends to evaluate future predictions.
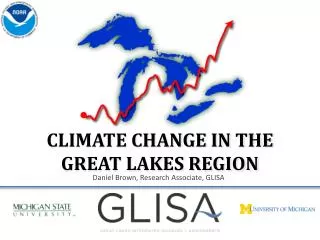
Location of the Lakes • Contain about 6 quadrillion gallons of water, and combined the lakes provide approximately 18% of the world’s freshwater supply.
Statistical Analysis • Mann-Kendall Analysis • Non-parametric method used in hydrologic data analysis to detect trends, using the S and Zs statistic. • Null hypothesis : there is no monotonic trend in the data. • Simple Linear Regression Analysis • Y = m x + b and R2 statistics • Used to test the slopes of the trend lines and estimate future values.
Lake Levels • At a 95% confidence interval the tests showed an increasing trend for the lake levels, except for Lake Superior • Mann-Kendall: • S-score = 1819 • Zs = 6.34 • Result = Increasing Trend • Simple Linear Regression: • Water Level = 158.32 + 0.0081*Year • (77.92) (7.78) • R2 = 0.408 Se = 0.256 F = 60.58
Temperature Trends • No statistically significant trends on overlake temperatures for Lake Erie, Huron, and Ontario, but there is an increasing trend for Lake Michigan and Lake Superior. • Mann-Kendall: • S-score = 135 • Zs = 0.92 • Result = No Trend • Simple Linear Regression: • Temperature = -6.806 + 0.009*Year • (-0.569) (1.54) • R2 = 0.039 Se = 0.743 F = 2.17
Flow Trends • There are no Statistically Significant Trends for streamflow
Precipitation Trends • Statistically Significant Increasing Trends for Lake Huron and Lake Ontario. • Mann-Kendall: • S-score = 423 • Zs = 2.83 • Result = Increasing Trend • Simple Linear Regression: • Precipitation = -224.4 + 0.150*Year • (2.269) (3.00) • R2 = 0.138 Se = 6.380 F = 8.975
Conclusions • No statistically significant conclusions can be drawn about assessing potential future predictions. • The increasing trend for the • lake levels can be explained • by looking at short term • fluctuations caused by strong • winds, storm surge and ice • development in the • connecting channels; and • long term crustal rebounding • and increase consumption • use.
Future Work • Look at the mass balance of the whole system and each lake individually to observe the contributing inflows and outflows and see how they have changed through time. • Analyze which factors are statistically important. • Compare the simple regression results with Global Climate Models.