Download
1 / 49
490 likes | 594 Views
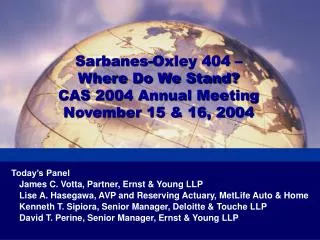
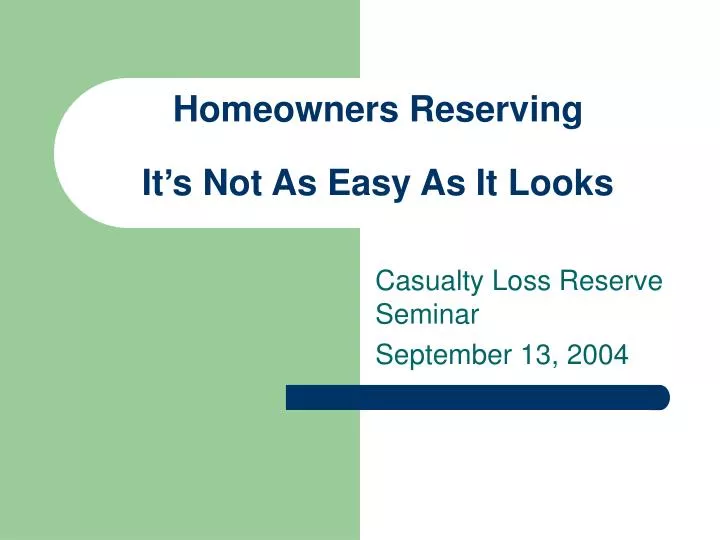
Homeowners Reserving It’s Not As Easy As It Looks. Casualty Loss Reserve Seminar September 13, 2004. Presenters. Mark Allaben FCAS, MAAA VP and Chief Actuary Personal Lines The Hartford Betsy DePaolo FCAS, MAAA VP and Actuary Personal Lines Reserving and CW Pricing Travelers.

E N D
Homeowners ReservingIt’s Not As Easy As It Looks Casualty Loss Reserve Seminar September 13, 2004
Presenters • Mark Allaben FCAS, MAAA • VP and Chief Actuary • Personal Lines • The Hartford • Betsy DePaolo FCAS, MAAA • VP and Actuary • Personal Lines Reserving and CW Pricing • Travelers
Homeowners Reserving 2003 Industry Schedule P data
Homeowners Reserving • Short Tailed • Within 12 months • 98% of ultimate claims have been reported • 96% of reported claims have been closed • 93% of ultimate dollars have been incurred • 85% of ultimate dollars have been paid • Many considerations in first year of development
Topics of Discussion • Catastrophes • Non Catastrophe Seasonality • Coverage Expansion/Contraction • Mix of Business • Reinsurance • Environmental Changes
Catastrophes • Seasonality of Occurrence • Differences in Development • Differences in Frequency • Differences in Severity • Other Issues • Catastrophe Modeling
CatastropheDefinition • ISO definition: Any event with industry insured damage greater than $25 million • Not just Hurricanes and Earthquakes • Can also include • Hail Storms / Thunderstorms • Snowstorms/Blizzards/Ice storms • Wildfires • Winter Freeze
CatastropheWildfire Seasonality • See Attached
Catastrophe Frequency and Severity • Differences in Frequency by quarter
Catastrophe Frequency and Severity • Differences in Severity by quarter
CatastropheSeasonality • Even the occurrence date within the quarter can have a significant impact on development • Examples: • Hurricane Isabel occurred on 9/18/03, near the end of the 3rd quarter • California Wildfires occurred in October 2003, the beginning of the 4th quarter
CatastropheDifferences in Development Hurricane Isabel 9/18/03 California Wildfires October 2003
CatastropheReserving Models • Use of Catastrophe Models • Post Storm Simulation • Storm Track, Wind speed, Tides • Exposure Based Projection • Deductibles, construction, location, specialized coverage • Adjust for local conditions • Demand Surge, Debris removal • One Tool in the Loss Reserving Tool Belt
CatastropheOther Issues • Large catastrophes may have extremely different claim patterns depending on circumstances • Difficulty in reaching claimants • Lack of Electricity, Phone service • Use of Additional Living Expense Coverage • Issues with Supply and Demand of building materials
CatastropheWebsites • Hurricane – National Hurricane Center • www.nhc.noaa.gov • Tornado – Storm Prediction Center • www.spc.noaa.gov • Wildfires – USDA Forest Service • www.fs.fed.us/fire/news
Non Catastrophe Seasonality • Differences in Frequency and Severity for Catastrophes vs. Non-Catastrophes • Catastrophe frequency is much lower than non-catastrophe frequency • Catastrophe severity is higher than non-catastrophe in 2nd and 3rd quarters, lower in 1st and 4th quarters
Coverage Expansion/Contraction • Mold • Sinkhole • Sewer Backup • Extra Contractual Liability • Automatic Increased Limits • Guaranteed Replacement Cost • Other?
Coverage Expansion/ContractionMold • Increases in frequency and severity of mold-related claims began to be seen in late 2000 / early 2001. • Majority of the claims were seen in the state of Texas. • Severity of claims much greater than average HO claim severity
Coverage Expansion/ContractionMold - Industry Reaction • Companies began implementing limits on mold coverage or excluding mold from coverage altogether • Typical mold limits are $5,000 or $10,000 • Limits caused average severity to begin leveling off
Coverage Expansion/ContractionReserving Issues with Mold • Mold claims tended to have longer development than normal HO claims • As exclusions and limits began to take effect, the development patterns seen during mold time period were no longer accurate predictors for development
Coverage Expansion/ContractionMold - One Reserving Method • Separate Mold from Other losses • Track separately • Create a Mold Prediction Model • Mold comes from Water Damage • Use Frequency and Severity Method • Number of water damage losses turn to mold • Average value of mold loss • Mold claims times average value equals losses
Coverage Expansion/ContractionMold Prediction Model Claims Incurred Water Claims Mold Average YearDamageMoldFreq. Losses Severity 2000 3,267 784 24.0% $22,805,776 $29,089 2001 3,223 896 27.8% $30,918,272 $34,507 2002 2,576 801 31.1% $22,339,890 $27,890 2003 3,2001,024 32.2% $15,360,000 $15,000 Note: 2003 includes a cap of $10,000 per mold claim.
Coverage Expansion/ContractionNew Mold Threat • Multiple events in a short Time Horizon • Damage from Hurricane Charley not repaired before Hurricane Frances hit • Electricity not restored to properly dry out property after a severe weather event • Tornados followed by severe thunderstorms
Coverage Expansion/ContractionExtra Contractual Liability (ECL) • “Bad Faith” Claim handling practices • Payments in excess of coverage amounts • Waiver of deductibles • Extension of additional living expenses • Negotiated losses/ settlements – coverage disputes • Increasing frequency • Impact is to lengthen the development tail
Coverage Expansion/ContractionGuaranteed Replacement Cost • Historically, in event of total loss, Guaranteed Replacement Cost (GRC) coverage could be purchased. • Insurers paid to completely rebuild home, regardless of Coverage A amount. • Problems with underinsurance led insurers to set limit on GRC, typically 120% or 125% of Coverage A • Such a change in exposure could result in a change in development patterns in data
Coverage Expansion/ContractionAutomatic Increased Limits • Annual provision to increase Coverage A (or Coverage C for Condo/Tenant) to account for inflation • Intended to limit chance of underinsurance • Does AIL change development patterns?
Coverage Expansion/ContractionOther??? • We don’t know what the next “issue” may be • Watch for changes in frequency, severity, development patterns. • Communicate with claim department regarding any trends they may be seeing • Implement detailed claim coding so the next issue can be quickly identified and tracked
Mix of Business • Coverage Form • State • Deductible
Mix of Business Coverage Form • Dwelling vs. Condo vs. Tenant Coverage • Average Developed Severity • Dwelling: 4,866 • Condo: 3,520 • Tenant: 3,286 • Average Incurred Frequency (x100) • Dwelling: 6.845 • Condo: 3.739 • Tenant: 1.807 Source: ISO HO Data cube, Accident Year 2002
Mix of BusinessState • Study performed on state-specific loss development patterns • Significant differences in 1st year of development • Predominant cause of loss in state appeared to be the primary factor • Four states (NC, SC, AL, WA), which has a heavier mix of fire claims, developed faster than other states (smaller LDF’s)
Mix of BusinessState • Incurred Claim Frequency (x 100) Source: ISO HO Data cube, Accident Year 2002
Mix of BusinessState • Developed Claim Severity Source: ISO HO Data cube, Accident Year 2002
Mix of BusinessDeductible • Changes in deductible buying patterns could impact both frequency and severity • Historically, deductibles of $100 and $250 were common • Consumers are moving to $500, $1000 and even $2,500 deductibles as a means to decrease their Homeowners premium
Reinsurance • Facultative • Catastrophe • Layers, Aggregates, Reinstatements • State Run Pools • Florida Hurricane Fund • Citizens (Florida) • Wind Storm Pools • Fair Plans
Environmental Changes • Claim behaviors have shown a marked changed in last several years • Claim frequency has been steadily declining over the past five years
Environmental ChangesClaim Behavior • Incurred Claim Frequency (x 100) Source: ISO HO Data cube
Environmental ChangesClaim Behavior • Pattern has been continuing in 2003 and 2004 • Drop in frequency most prominent at smaller claim levels • Some of the frequency drop may be explained by changes in deductible selections • But drop in frequency is also seen at claim sizes larger than average deductible • Consumers concerned about large rate increases following a claim and/or being cancelled/non-renewed • Consumers are effectively self-insuring • Corresponding severities have exhibited an upwardtrend
Conclusions • Homeowners reserving may be easier than most other lines but watch out for the pitfalls • Separate Catastrophe and Non-Catastrophe Claims • Examine data by Accident Quarter • Watch for signs of unexpected coverage expansion or contraction which may impact patterns • Watch for changes in mix of business (coverage form, state, deductible) • Consider the impact of reinsurance • Watch for changes in consumer/claimant behavior that may signal a turn