Download
1 / 1
10 likes | 98 Views
This study aimed to determine the within- and between-day variability of the hypoxic ventilatory response (HVR) during isocapnic hypoxia. Results showed no significant differences in HVR within or between days, with a variability of approximately 27%. Findings suggest the need for repeated tests to estimate HVR accurately. The study highlights the importance of considering variability in population comparisons using single measurements.

E N D
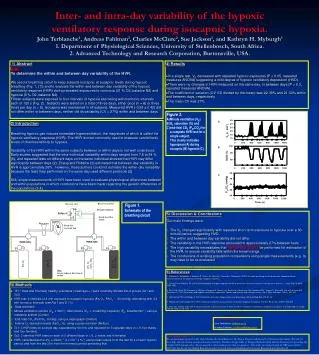
A B C Inter- and intra-day variability of the hypoxic ventilatory response during isocapnic hypoxia.John Terblanche1, Andreas Fahlman1, Charles McClure2, Sue Jackson1, and Kathryn H. Myburgh1 1. Department of Physiological Sciences, University of Stellenbosch, South Africa. 2. Advanced Technology and Research Corporation, Burtonsville, USA. 1) Abstract Aim: To determine the within and between day variability of the HVR. We used a breathing circuit to keep subjects isocapnic at eucapnic levels during hypoxic breathing (Fig. 1, (1)) and to evaluate the within and between day variability of the hypoxic ventilatory response (HVR) during repeated exposures to normoxia (21 % O2, balance N2) and hypoxia (8 % O2, balance N2). Fifteen subjects were exposed to four intervals of hypoxia alternating with normoxic intervals each of 120 s (Fig. 2). Subjects were tested on a total of three days, either once (n = 6) or three times per day (n = 9). Isocapnia was maintained in all subjects. Measured HVR (-0.59 ± 0.42) did not differ within or between days, neither did its variability (CV = 27%) within and between days. • 4) Results • In a single test, VE decreased with repeated hypoxic exposures (P < 0.05, repeated measures ANOVA) suggesting a mild degree of hypoxic ventilatory depression (HVD). • There were no changes in HVR measured on the same day, or between days (P > 0.3, repeated measures ANOVA). • The coefficient of variation (CV, SD divided by the mean) was 22-38% and 21-33% within and between days, respectively. • The mean CV was 27%. • Figure 2. • Minute ventilation (VE) • O2 saturation (%) and • end-tidal CO2 (PETCO2) for a complete HVR test for a single subject. • This clearly indicates hyperpnea (A) during eucapnic (B) hypoxia (C). 2) Introduction Breathing hypoxic gas induces immediate hyperventilation, the magnitude of which is called the hypoxic ventilatory response (HVR). The HVR is most commonly used to measure carotid body levels of chemosensitivity to hypoxia. Variability of the HVR within the same subjects between or within days is not well understood. Early studies suggested that the intra-individual variability within days ranged from 7.6 to 64 % (6), and repeated tests on different days on the same individual showed that HVR may differ significantly between days (2). Zhang and Robbins (2) estimated that between-day variability in HVR is approximately 26%. However, these authors could not estimate the within-day variability because the tests they performed on the same day used different protocols (2). Still, single measurements of HVR have been used to evaluate physiological differences between and within populations in which conclusions have been made regarding the genetic differences of the populations (3,4). Figure 1. Schematic of the breathing circuit 5) Discussion & Conclusions Our main findings were: The VE changed significantly with repeated short-term exposure to hypoxia over a 30-minute period, suggesting HVD. The within and between day variability did not differ. The variability in the HVR response amounted to approximately 27% between tests. The high variability necessitates that REPEATED TESTS be performed for estimation of the HVR, to ensure variability falls within the known range. The conclusions of existing population comparisons using single measurements (e.g. 3)may have to be re-evaluated. B C • 6) References • 1. Fahlman A, Terblanche J, Jackson S,Fisher JA, Vesely A, Sasano H, Myburgh K (2002) A simple breathing circuit to maintain isocapnia during measurements of the hypoxic ventilatory response. In press. 2. Zhang S and Robbins PA (2000) Methodological and physiological variability within the ventilatory response to hypoxia in humans . J Appl Physiol 88(5): 1924-1932 3. Beall CM, Strohl KP, Blangero J, Williams-Blangero S, Almasy LA, Decker MJ, Worthman CM, Goldstein MC, Vargas E, Villena M, Soria R, Alarcon AM, Gonzales C (1997) Ventilation and hypoxic ventilatory response of Tibetan and Aymara high altitude natives. Am J Phys Anthropol 104(4): 427-447 4. Hochachka PW and Monge C (2000) Evolution of human hypoxia tolerance physiology. Adv Exp Med Biol 475: 25-43 5. Rebuck AS and Campbell EJ (1974) A clinical method for assessing the ventilatory response to hypoxia. Am Rev Respir Dis 109(3): 345-350 6. Sahn SA, Zwillich CW, Dick N, McCullough RE, Lakshminarayan S, Weil JV (1977) Variability of ventilatory responses to hypoxia and hypercapnia. J Appl Physiol 43(6): 1019-1025 • 3) Methods • 15 (7 male and 8 female)healthy volunteers (mean age = ) were randomly divided into 2 groups (Gr1 and Gr2). • HVR test: 4 intervals of 2-min exposure to eucapnic hypoxia (8% O2, PAO2~60 mmHg) alternating with 4 2-min normoxic intervals (see Fig 1 and 2, (1)). • Data recorded: • Minute ventilation volume (VE, L•min-1), tidal volume (VT, L) breathing frequency (FR, breaths•min-1), using a metabolic system (Cortex). • End-tidal CO2 (PetCO2, mmHg), using a capnograph (Oridion) • Arterial O2 saturation levels (SaO2, %), using a pulse oximeter (Nellcor). • Gr1: 3 HVR tests on a single day, separated by 60 min, and repeated on 3 separate days (n = 9, five males and four females). • Gr2: 3 identical HVR tests on each of 3 different days (n = 6, 2 males and 4 females). • HVR, calculated as the ∆VE∆SaO2-1 (L min-1 %-1) using mean values from the last 30 s of each hypoxic period, and from the last 30 s from the normoxic period preceding that. Contact Information, e-mail: John Terblanche: jst@sun.ac.za Andreas Fahlman: a.fahlman@bham.ac.uk Acknowledgements: We are particularly grateful to Mr. Alan Thomas, Mr. Nick Robinson, Mr. Shaun Thaysen and the staff of National Hyperbarics (Pty Ltd) for their help with gas mixing, saving both money and time. Thanks to Peggy Schlie of Dräger (Medizintechnik GmbH, Germany) for providing the Oxidem 3000 demand valve. We are grateful to all our subjects for their cooperation. This study was funded mainly by NRF grant (GUN 2047146), but also by the Medical Research Council of South Africa and Stellenbosch University Research Sub-Committee B.